Iteration 1
Using Microsoft Excel to Visualize Tables Containing Numbers
- Microsoft Excel is a data processing and visualization tool that allows rule-based manipulation of numerical data.
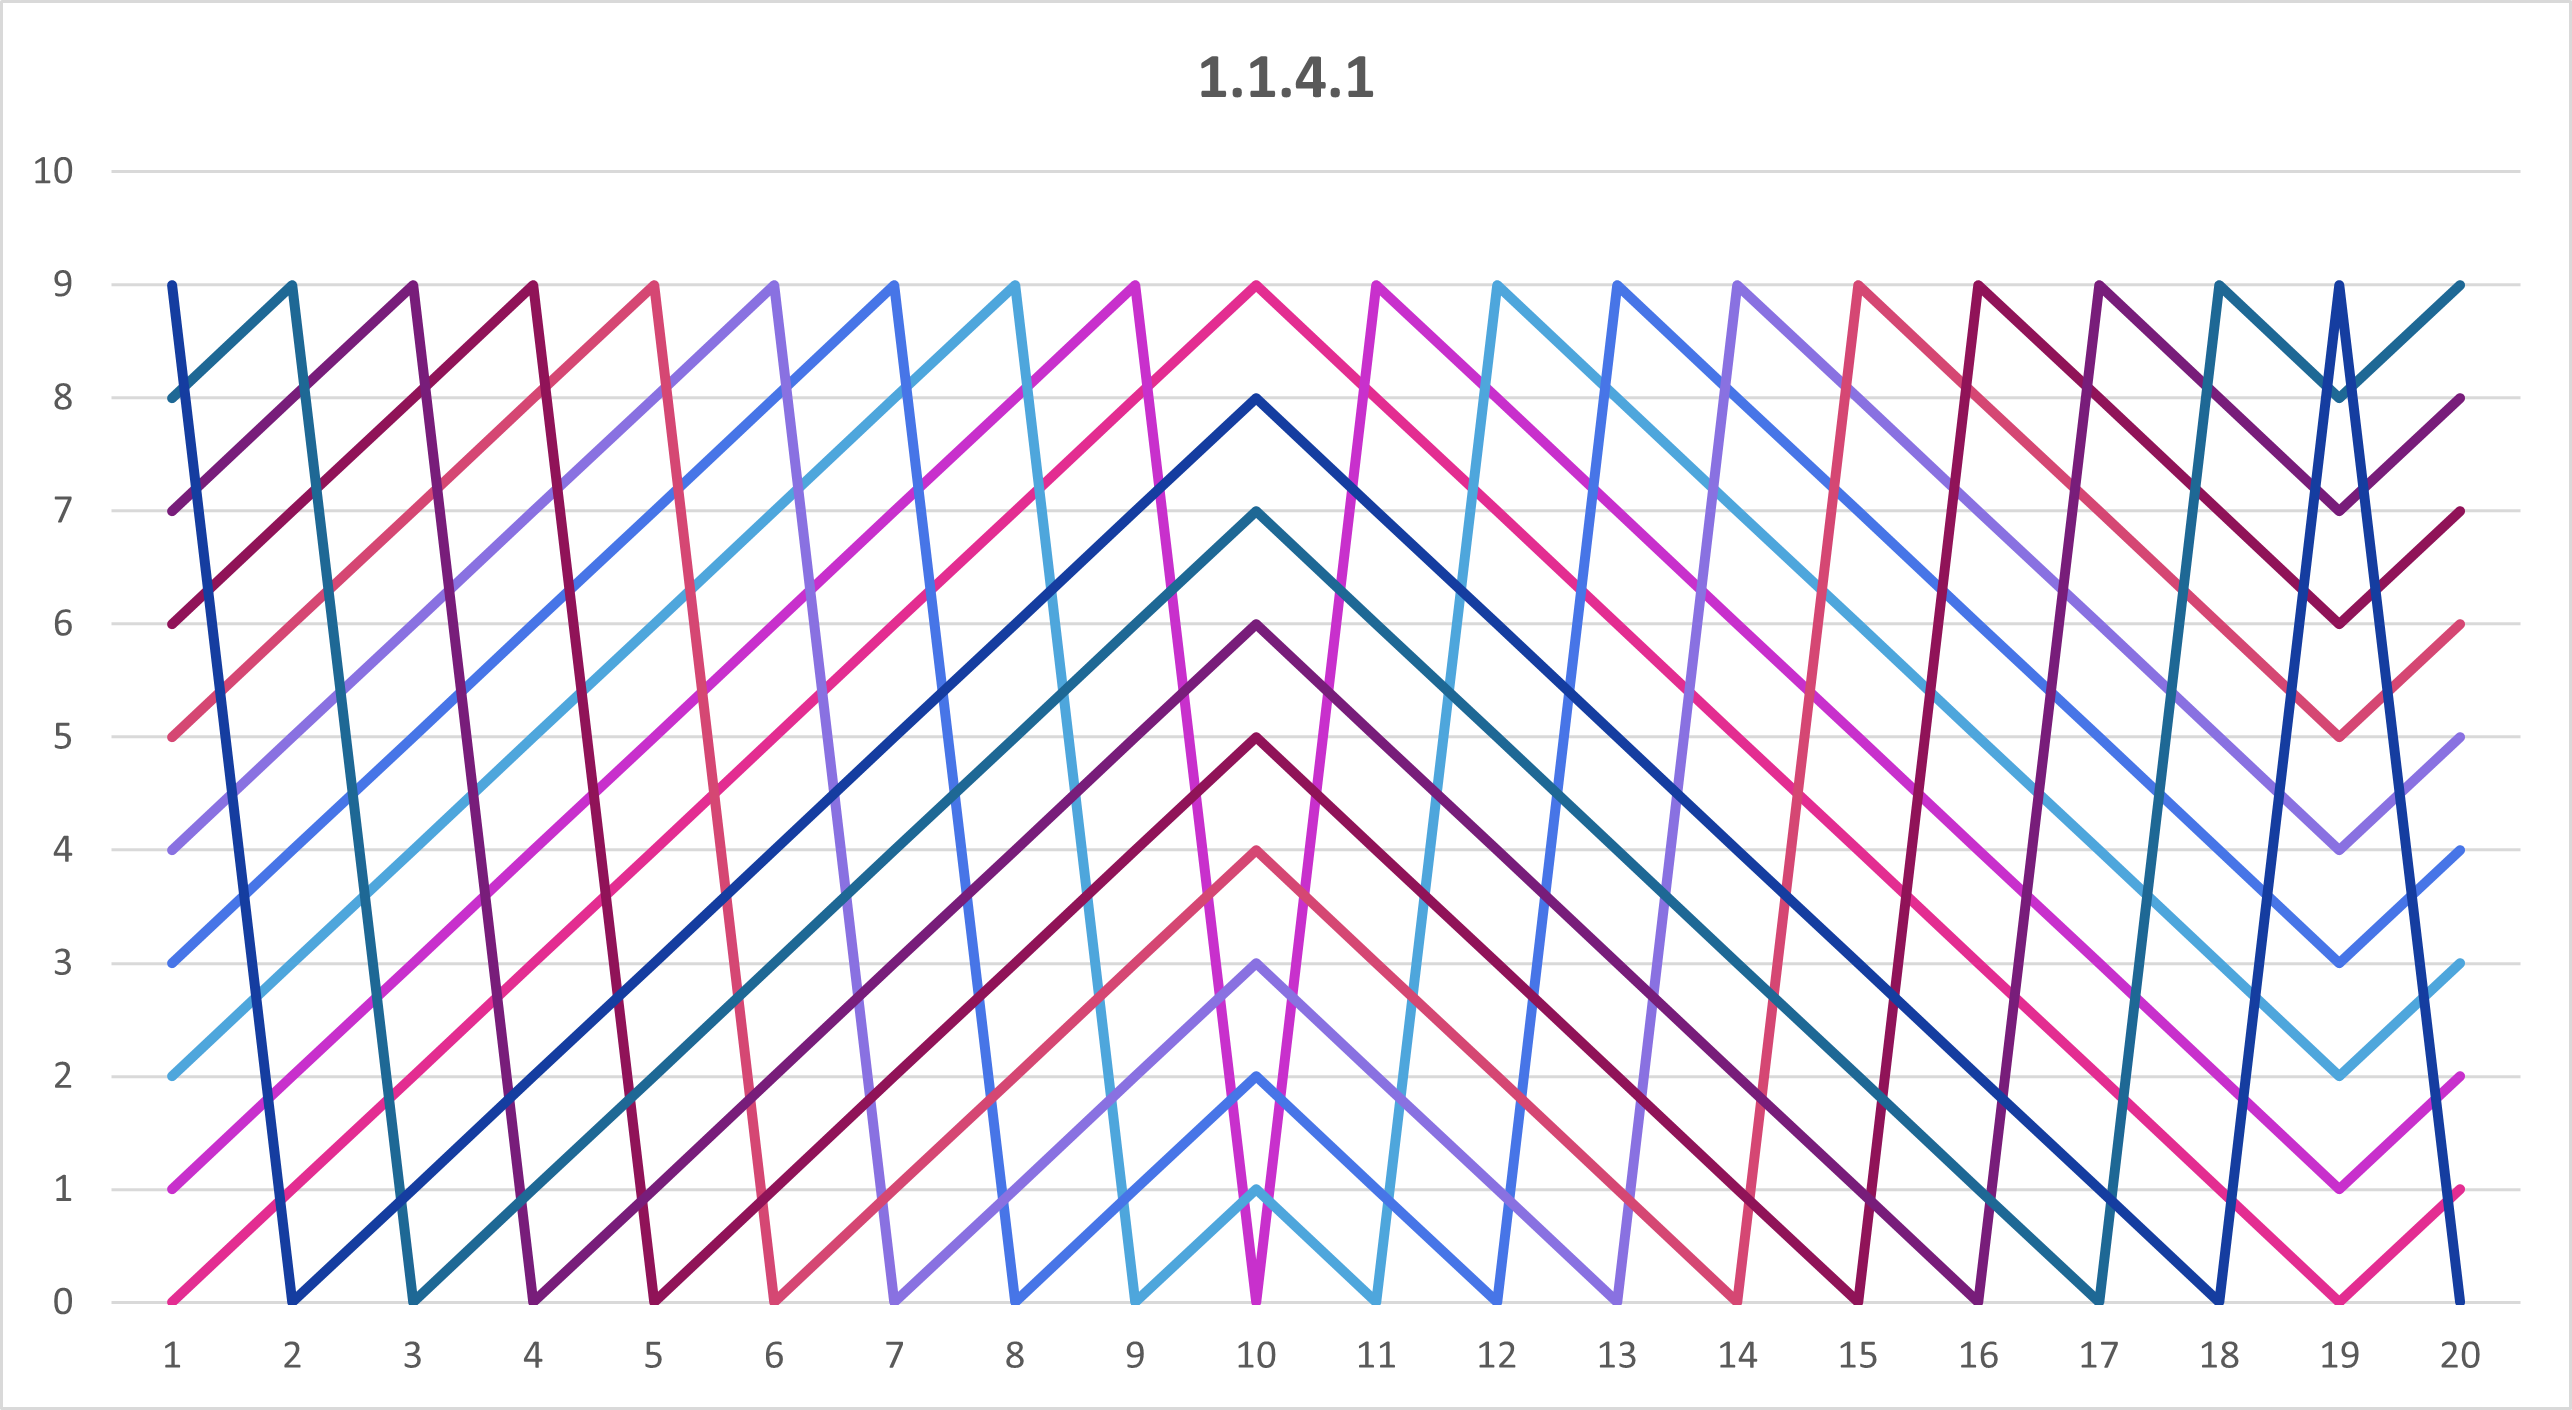
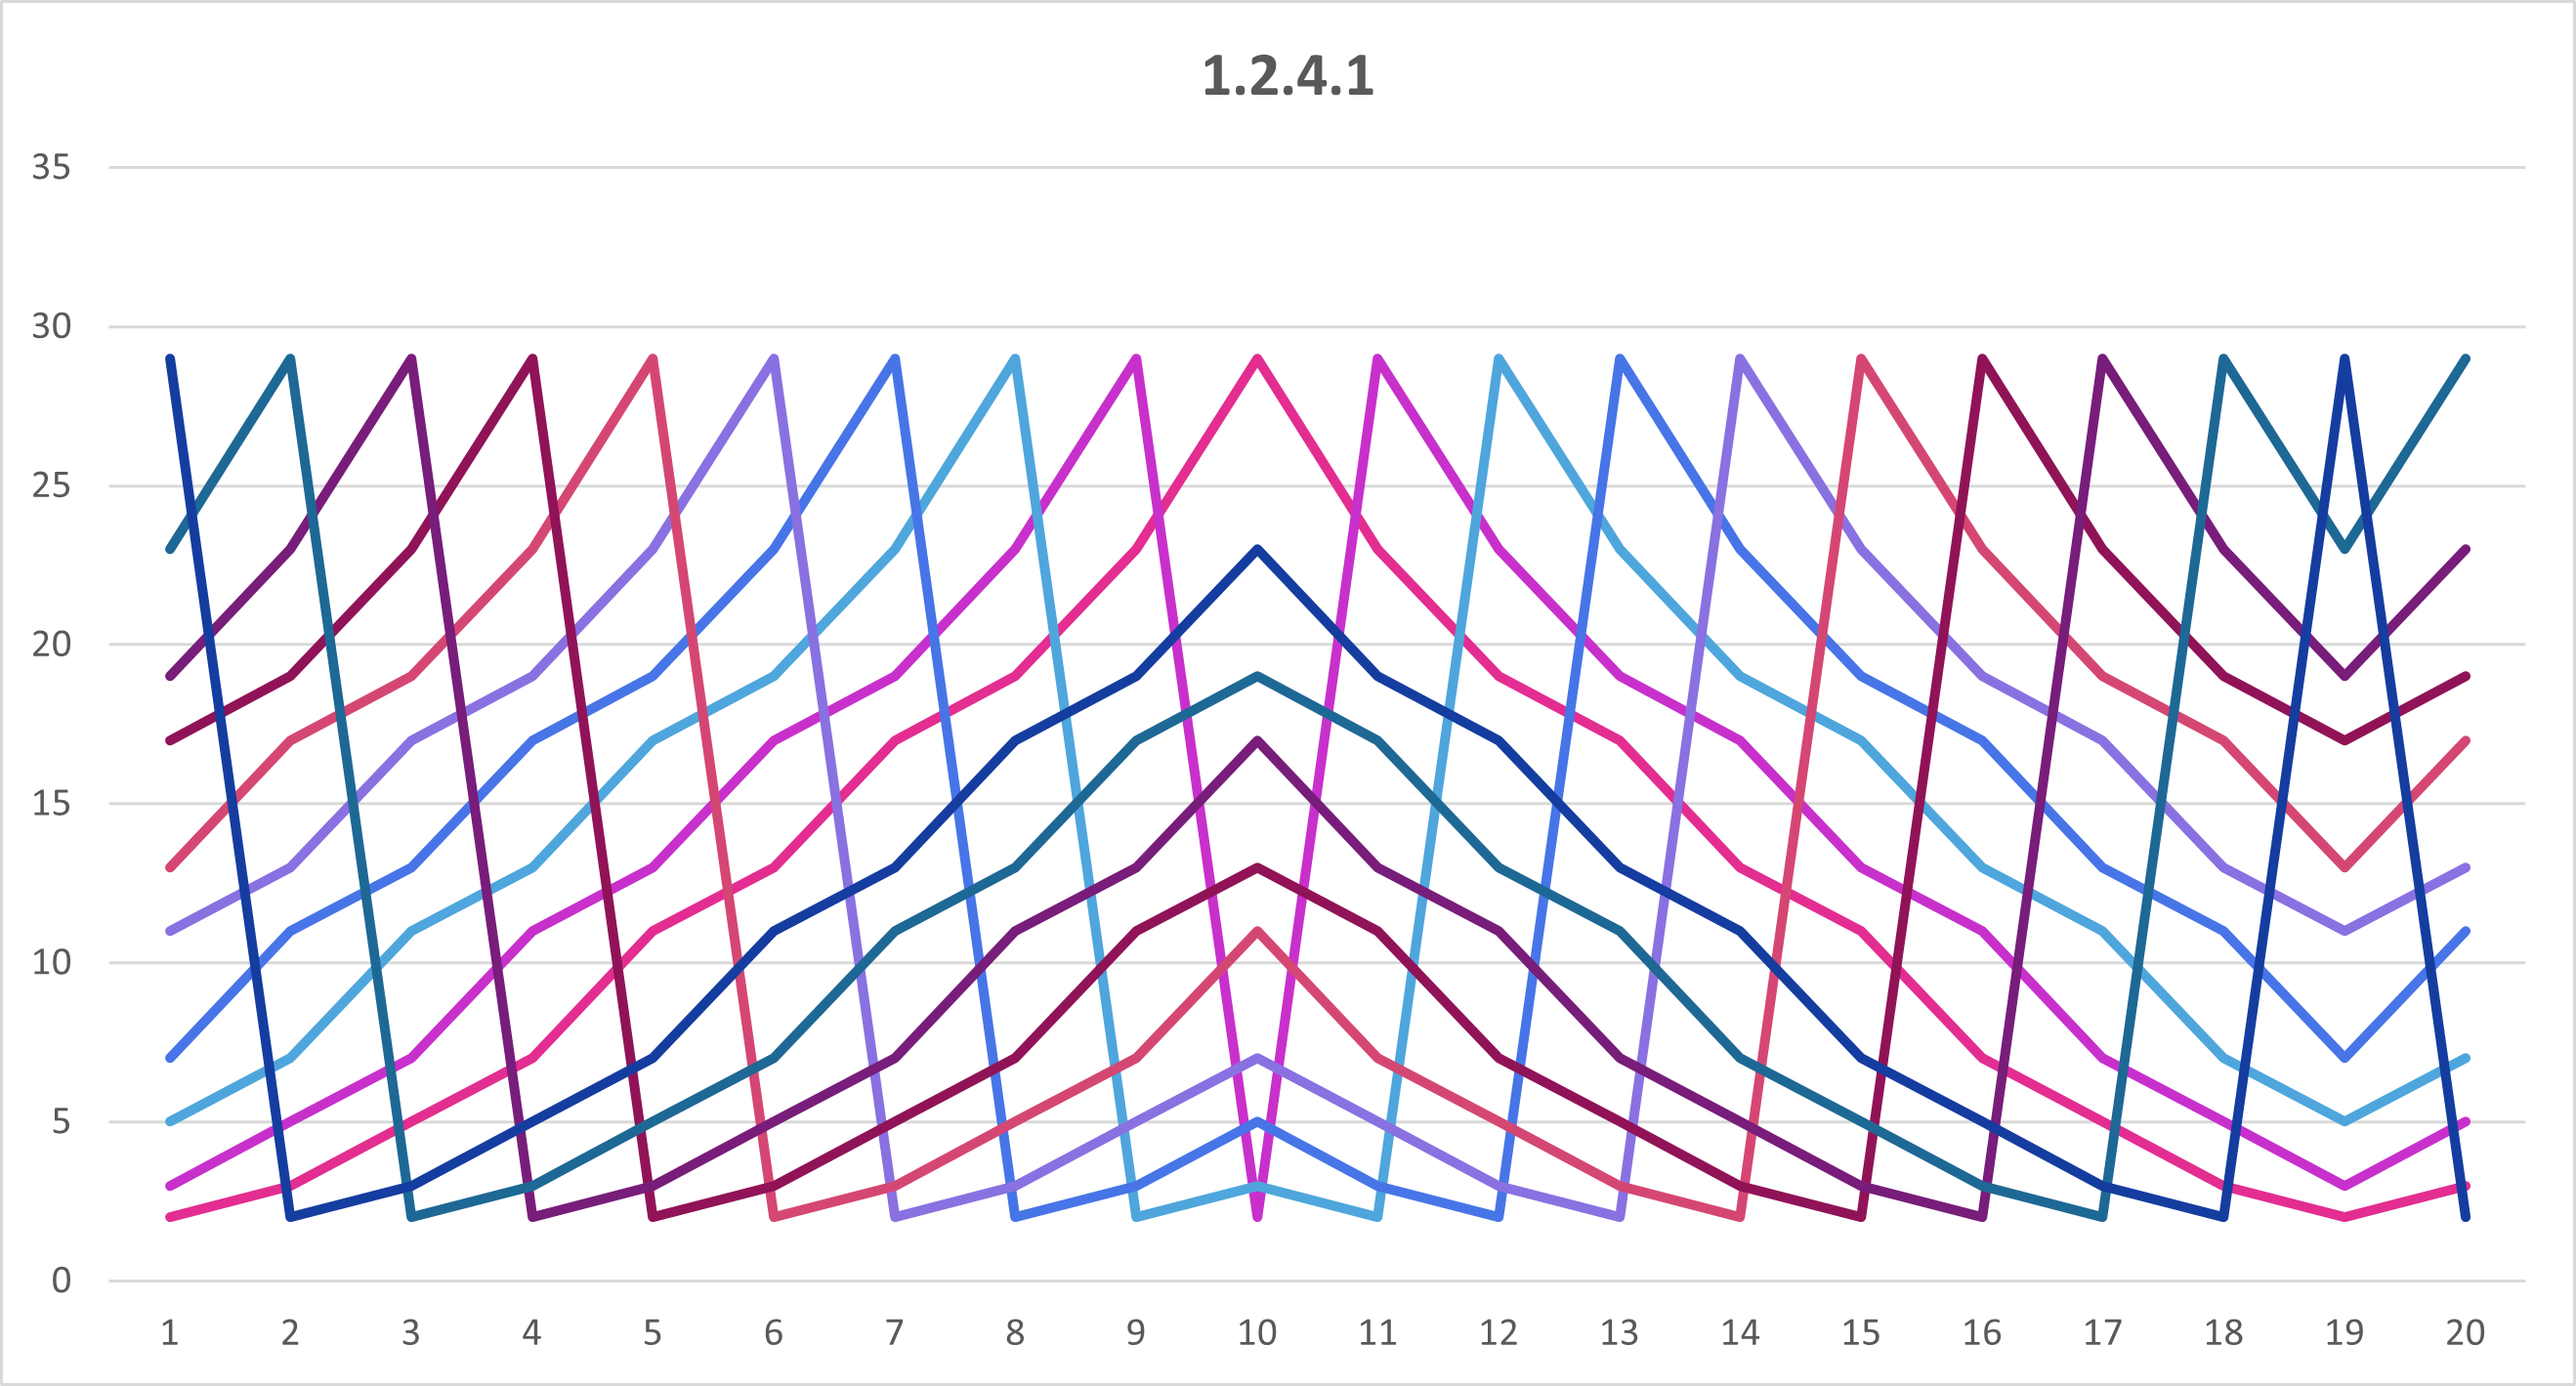
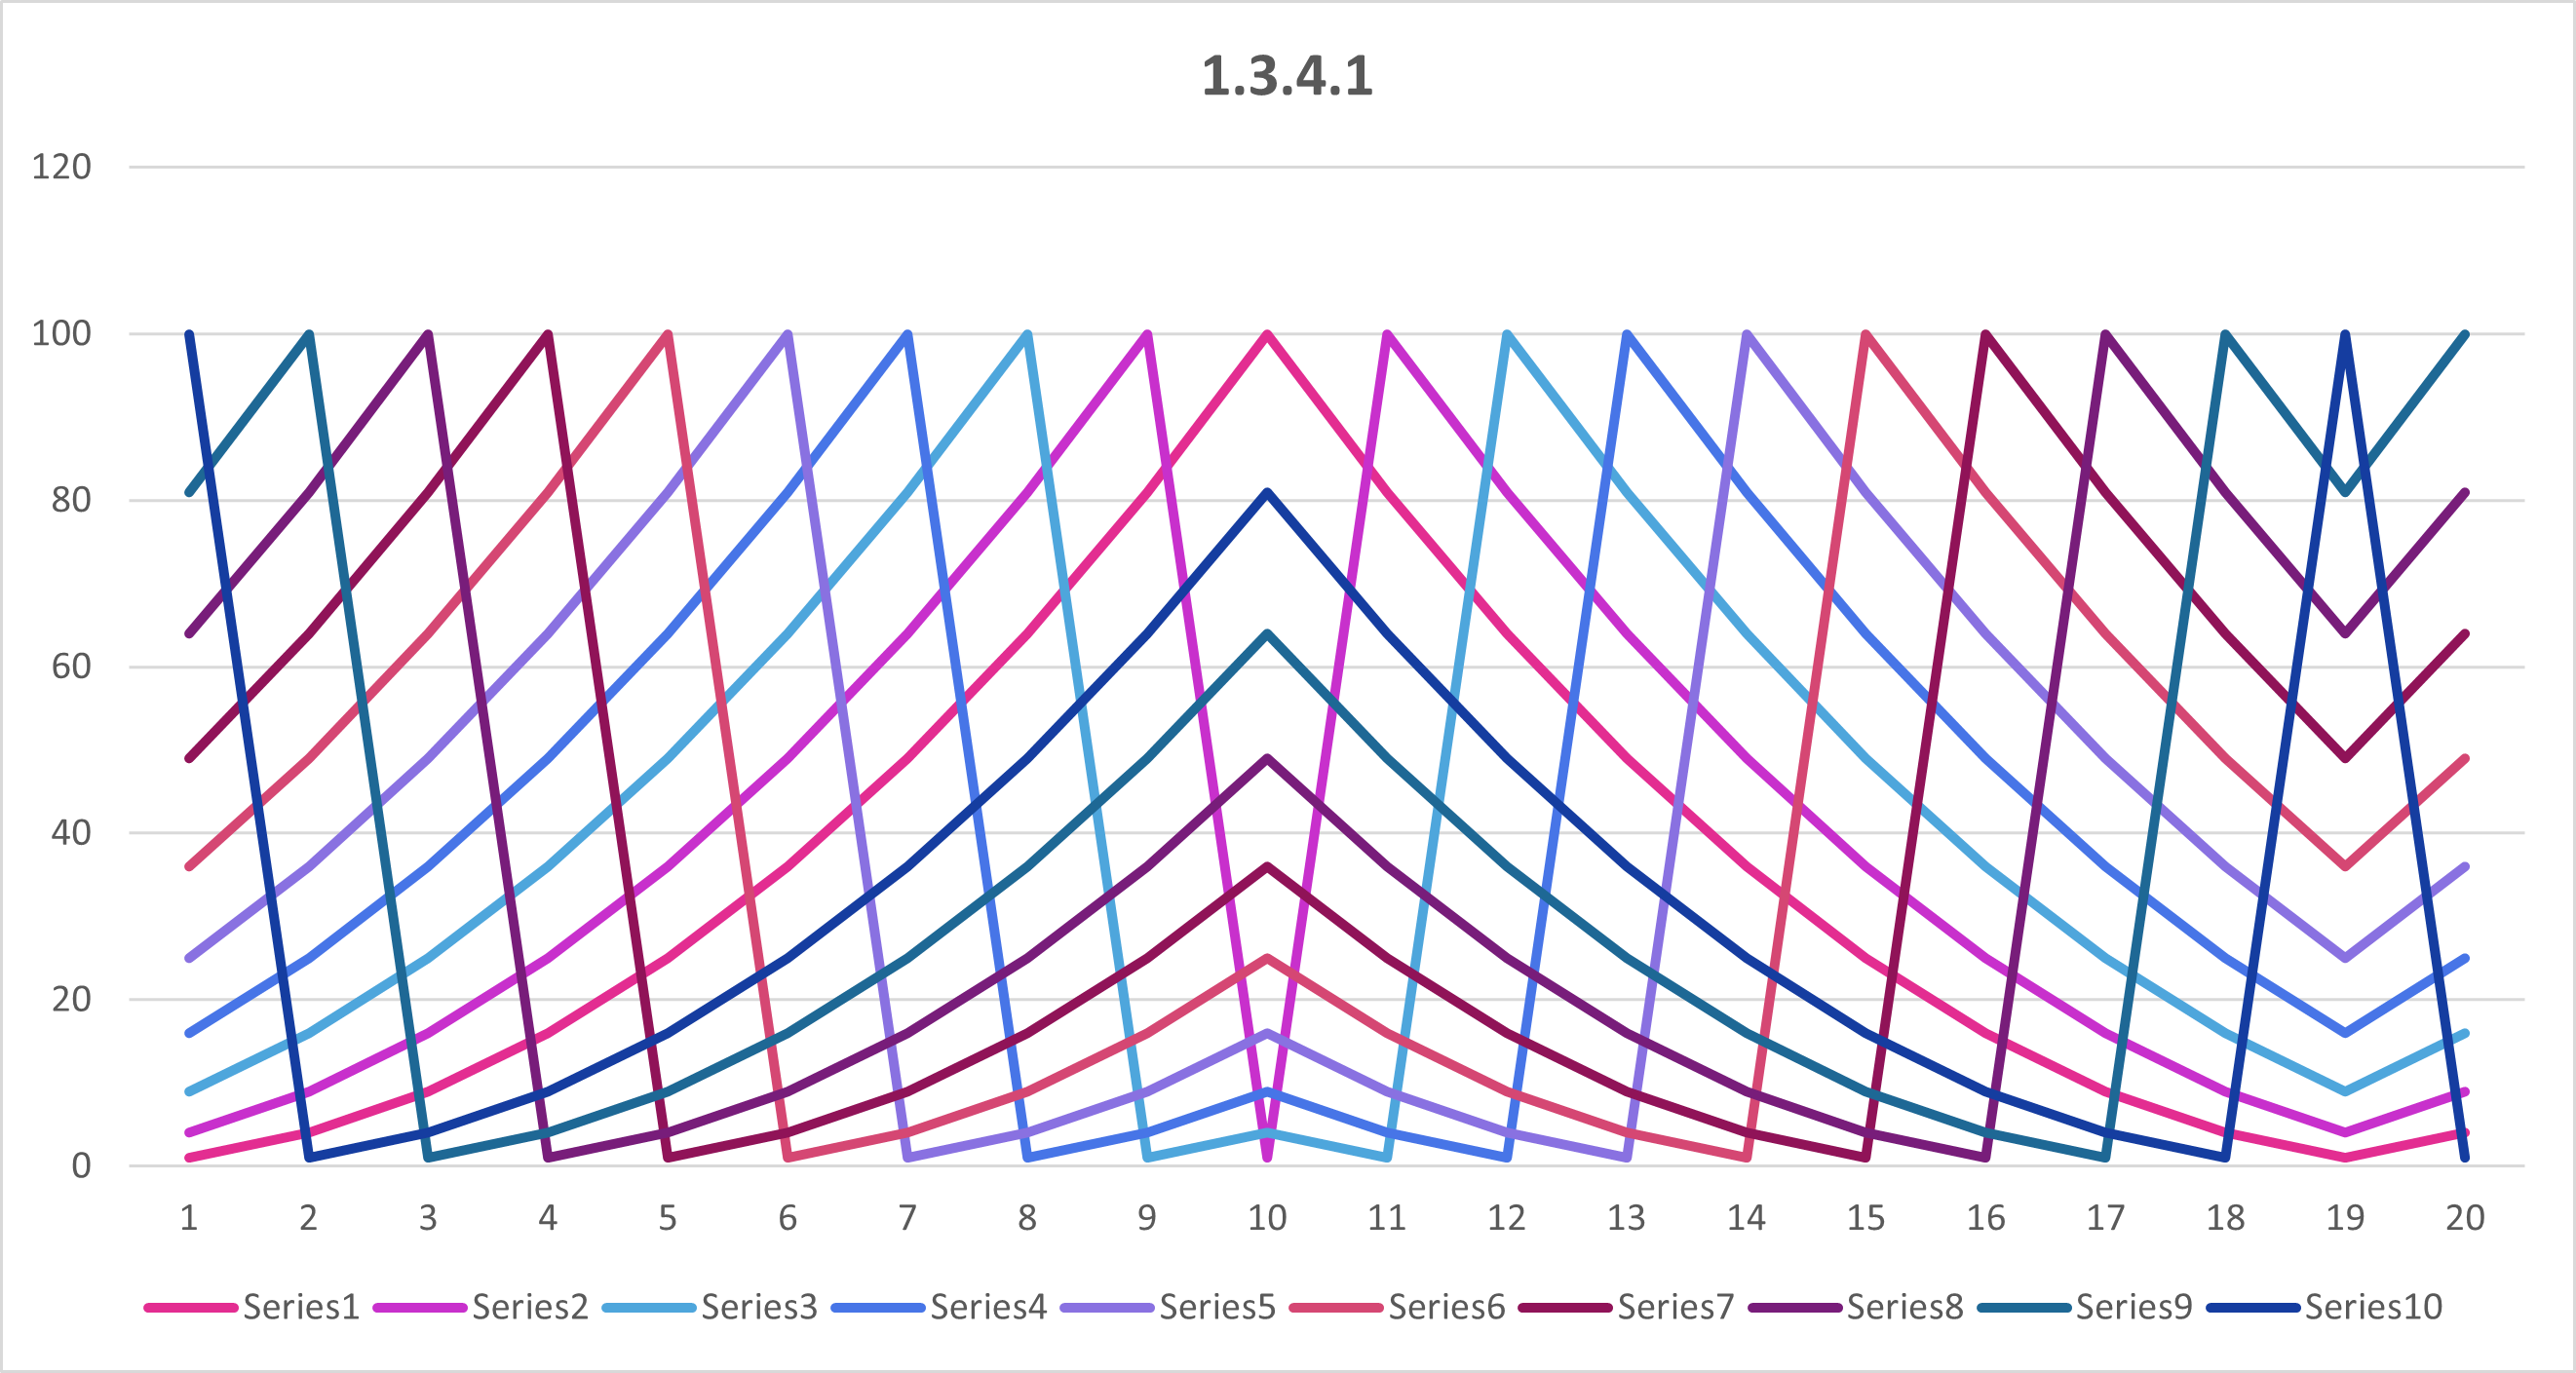
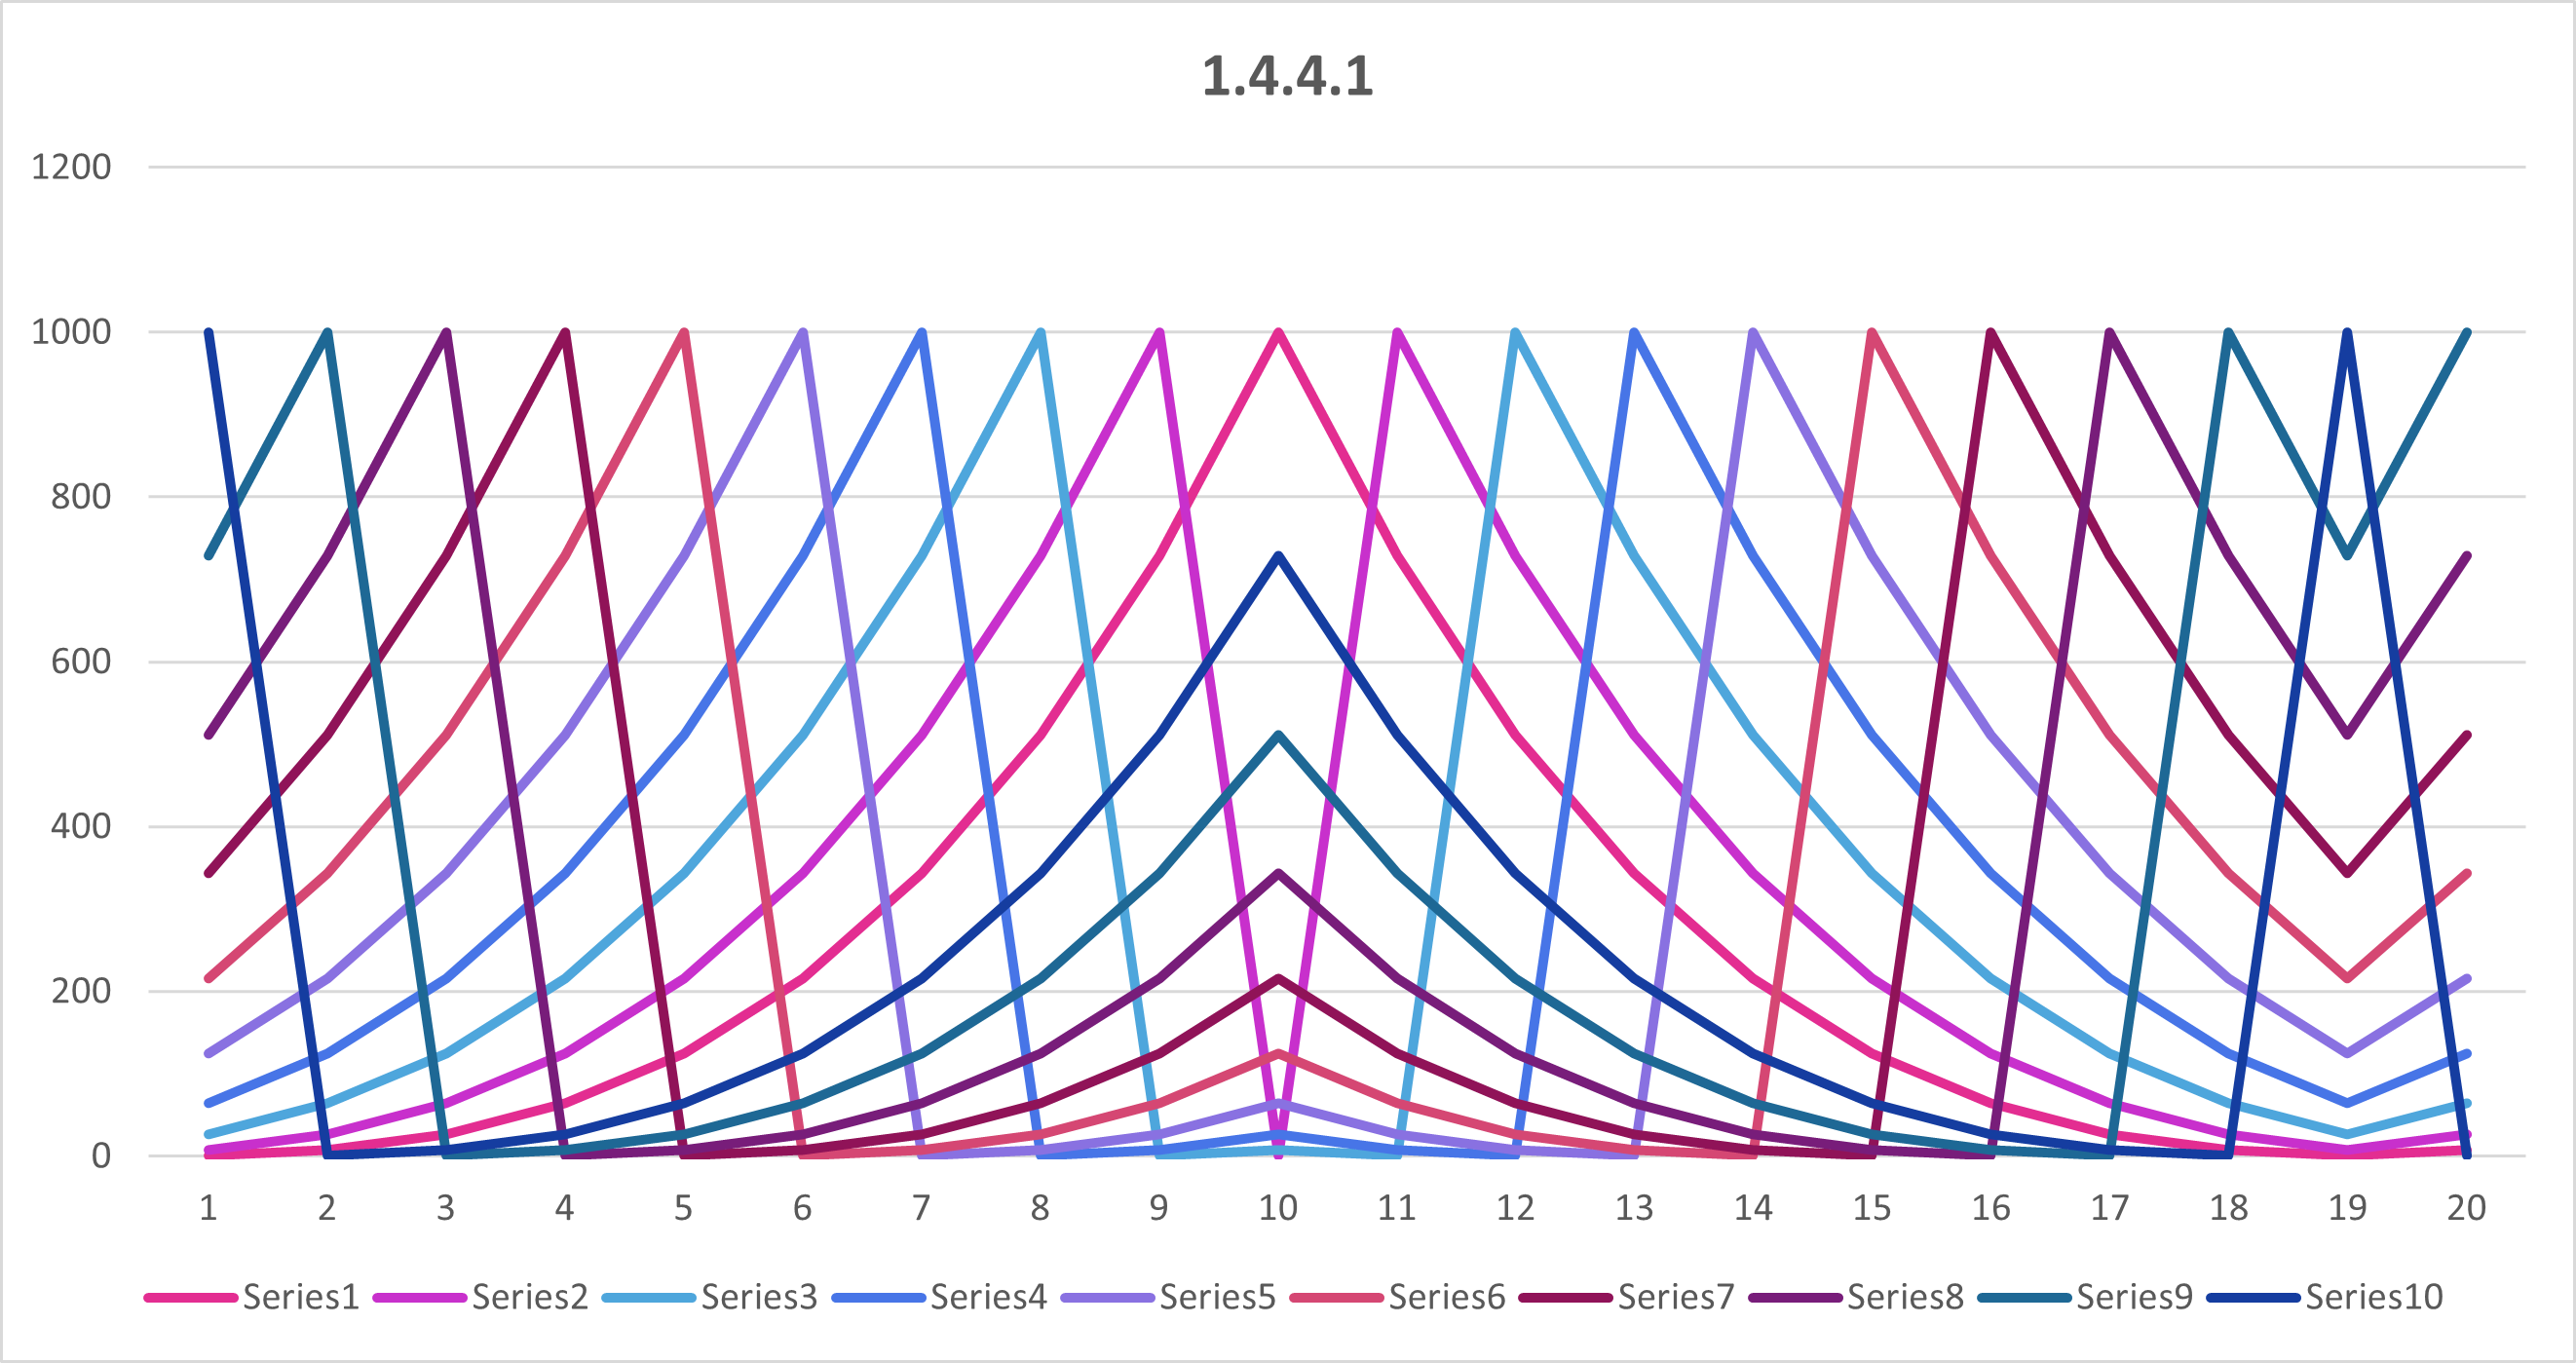
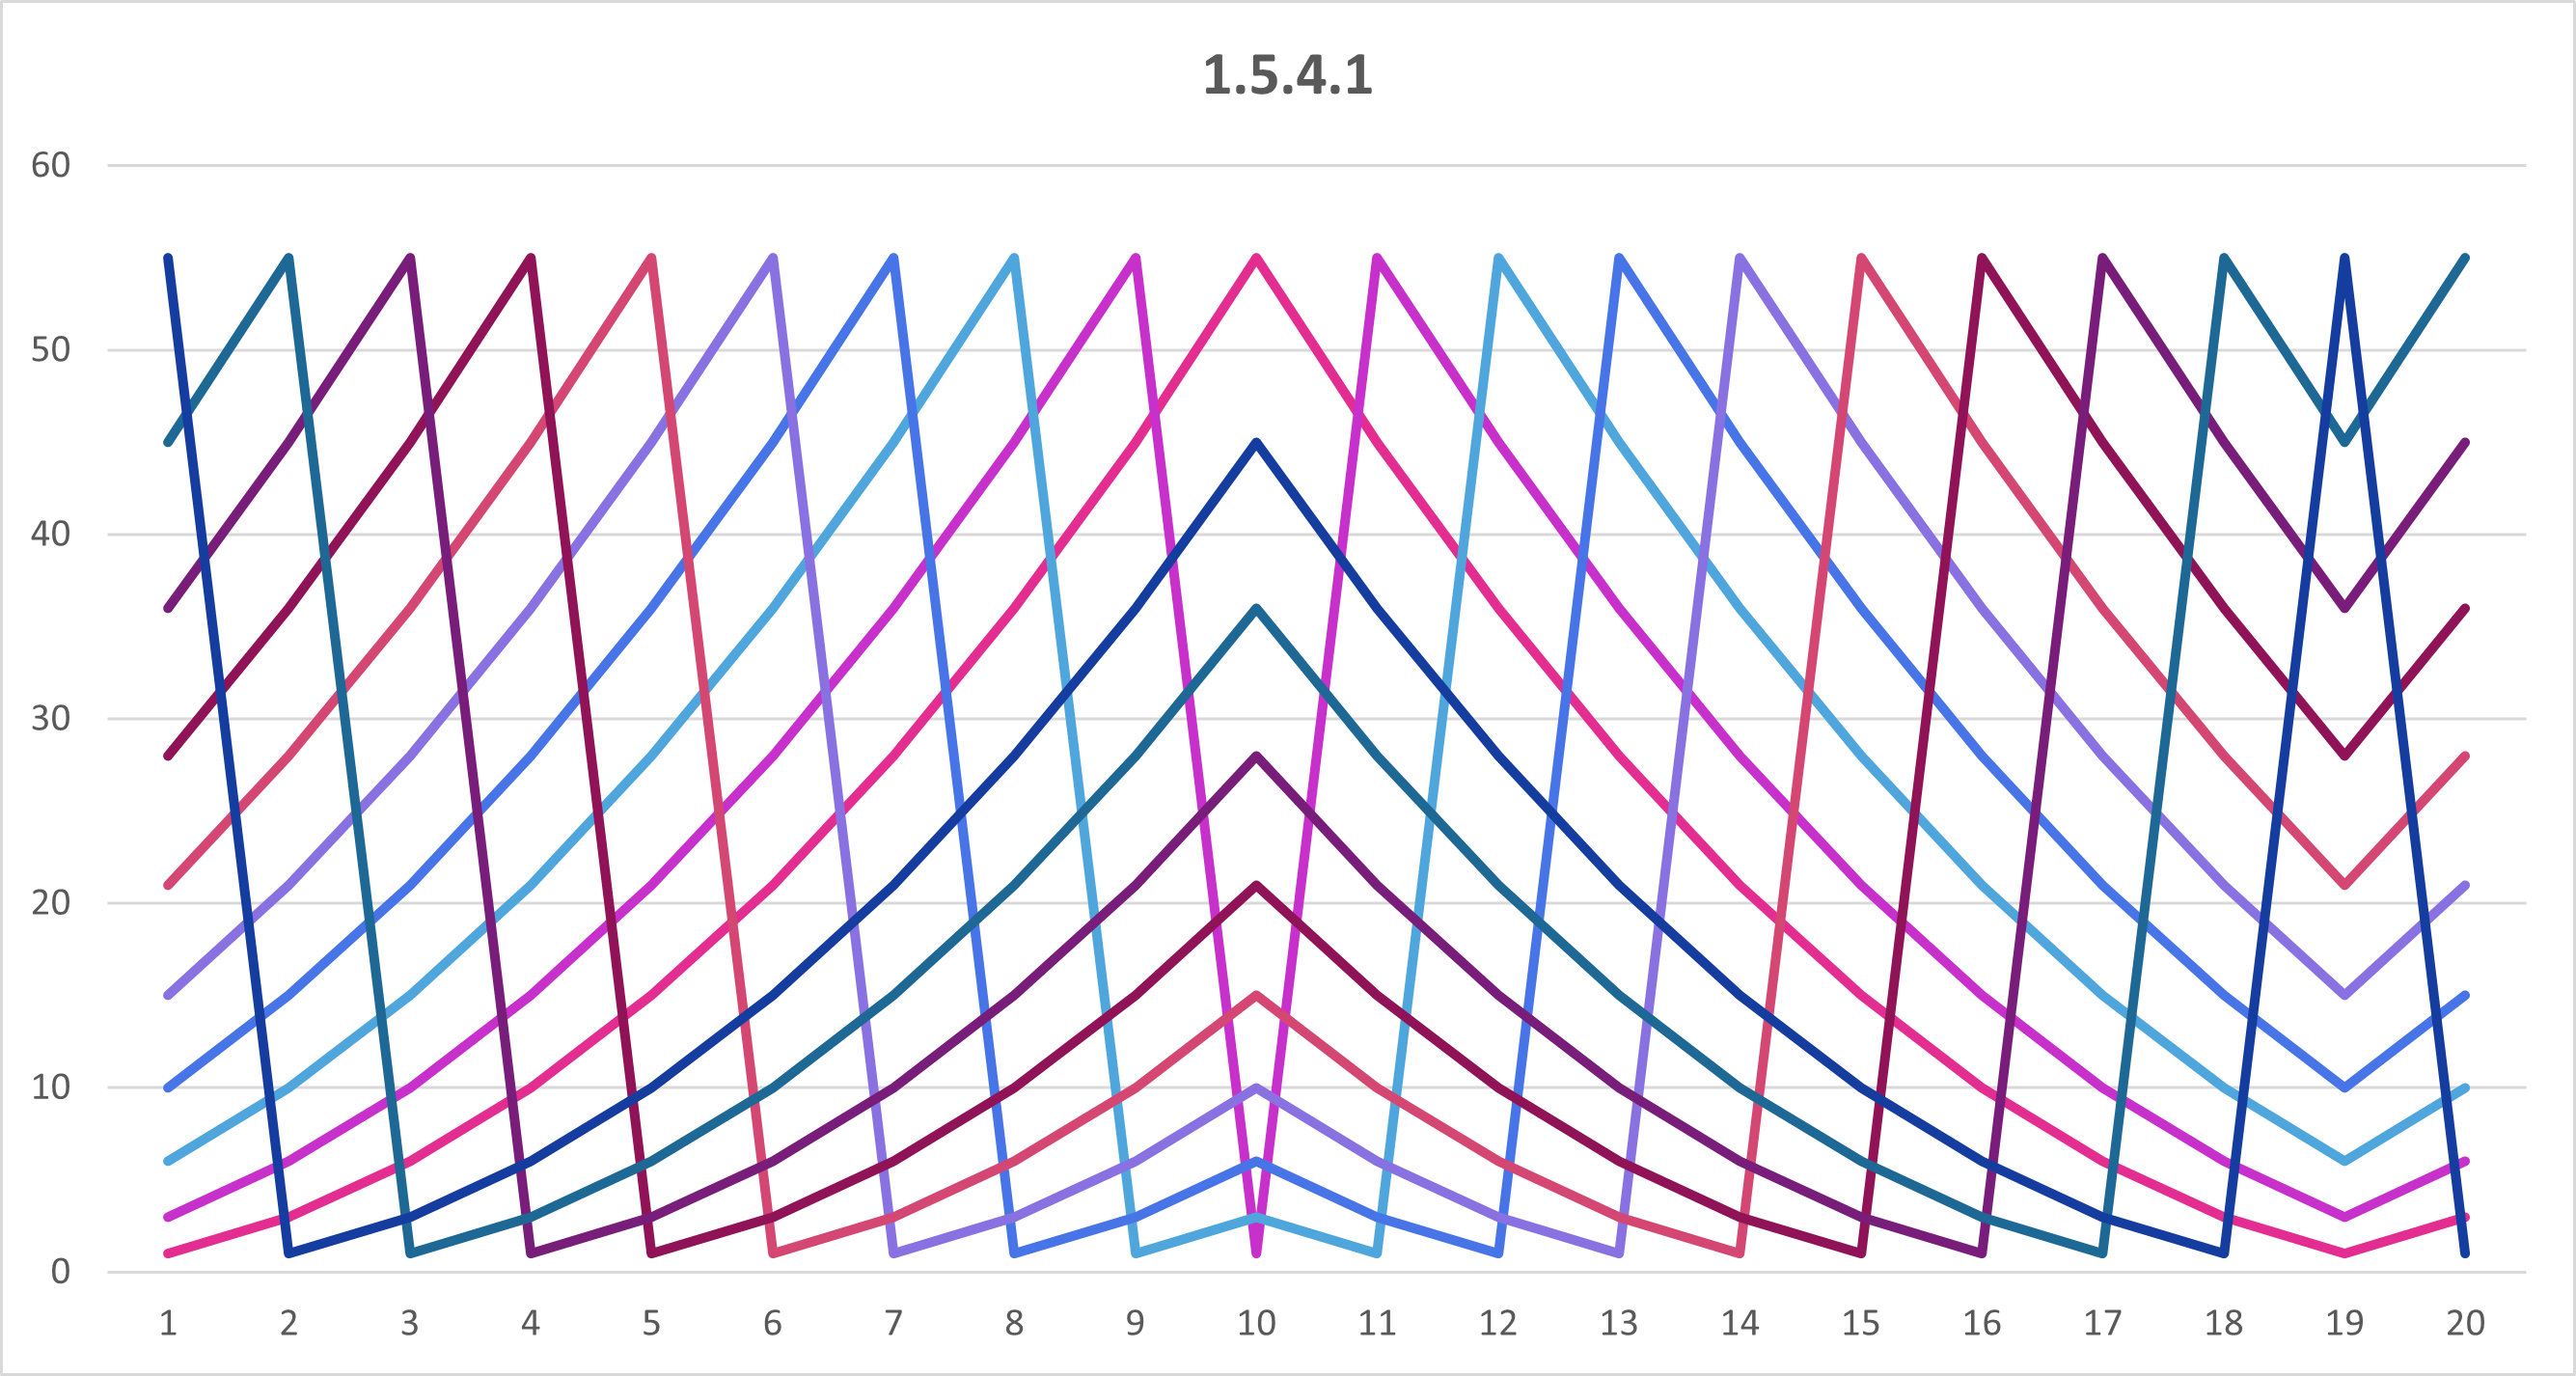
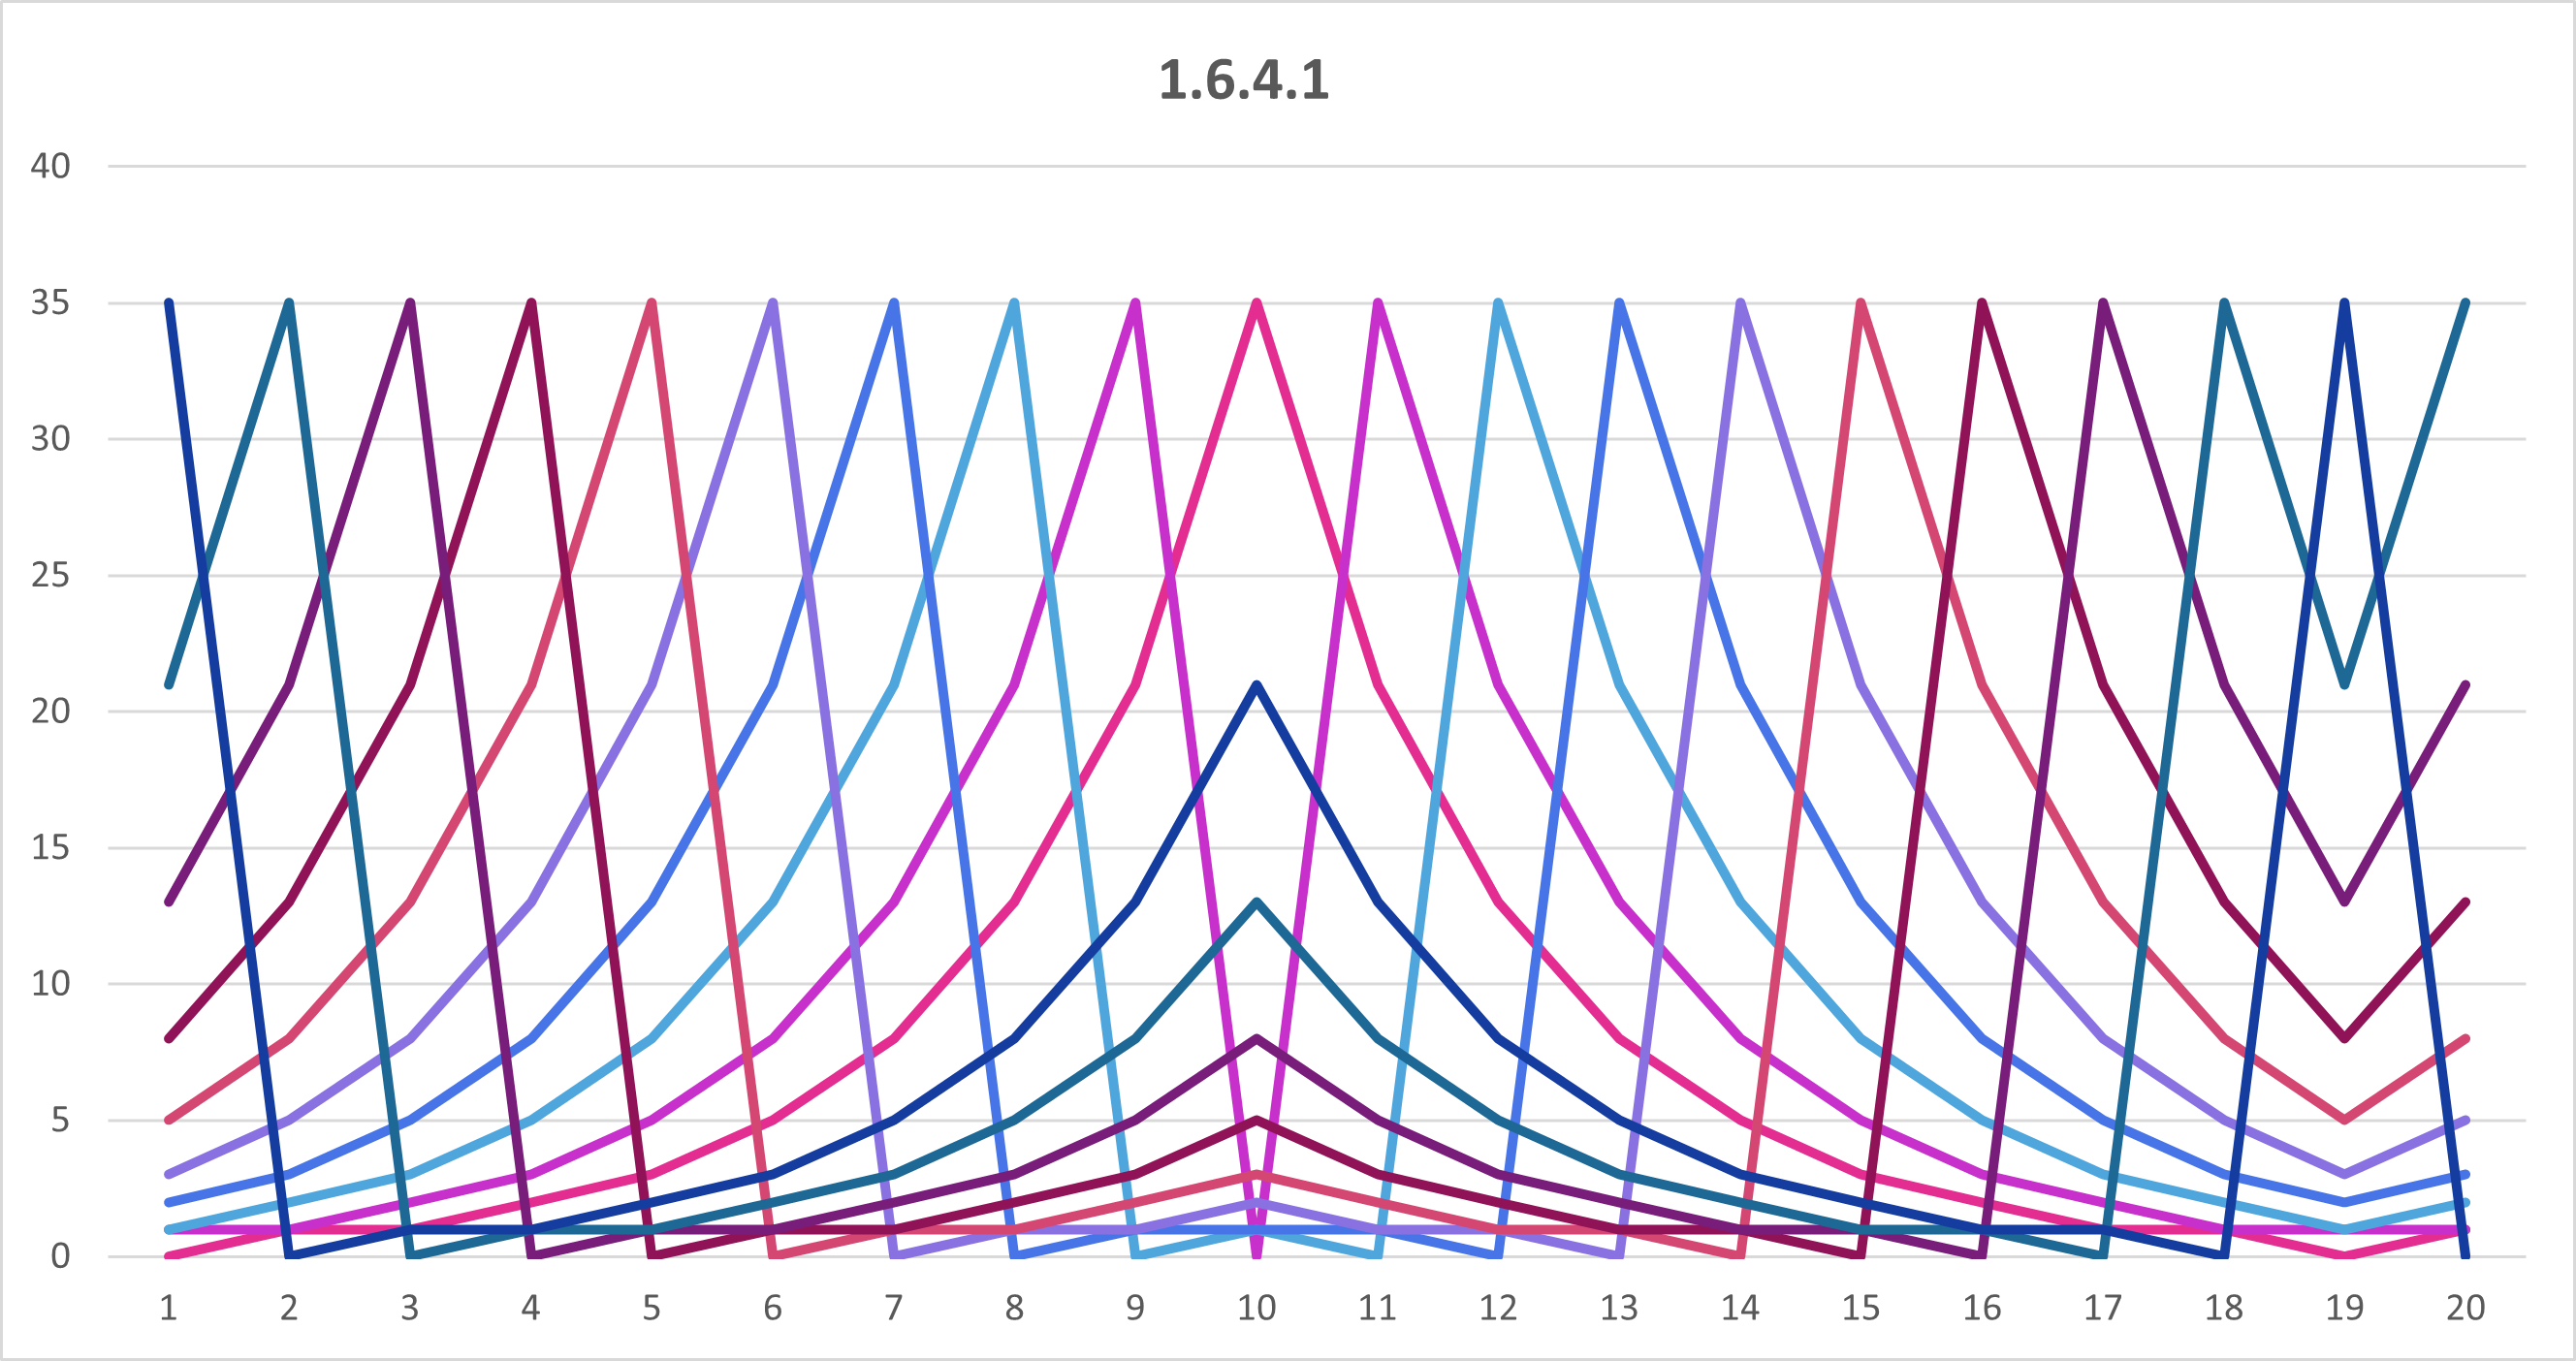
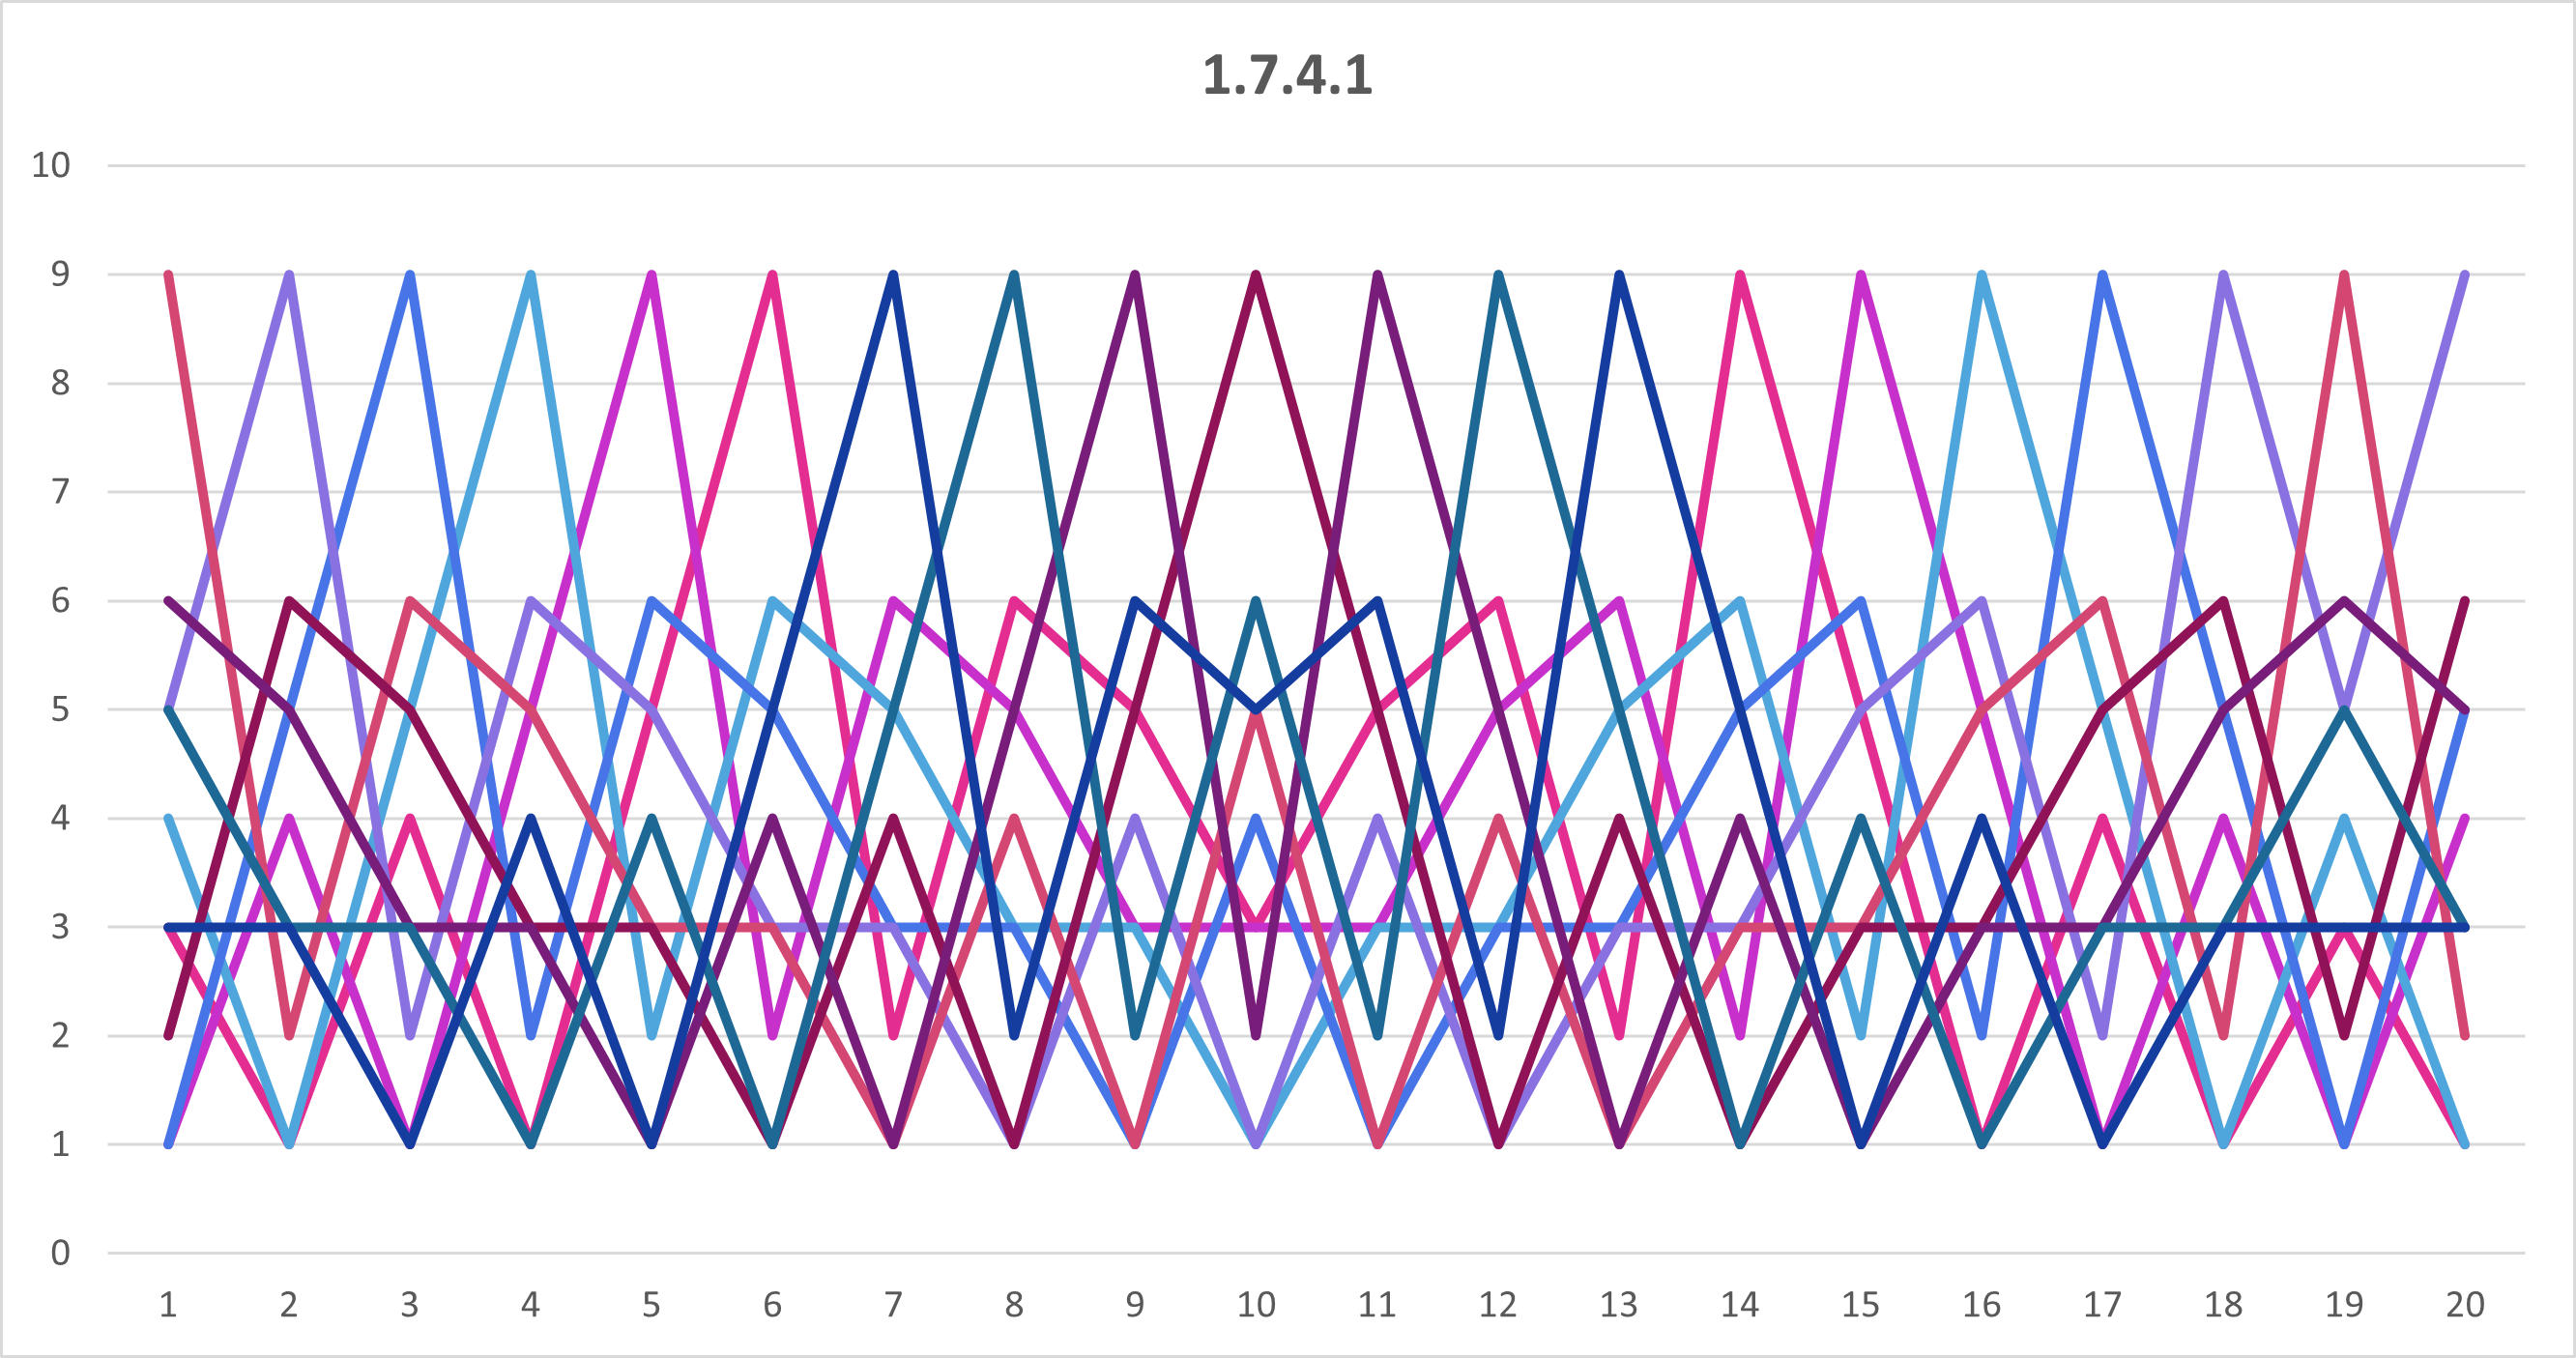
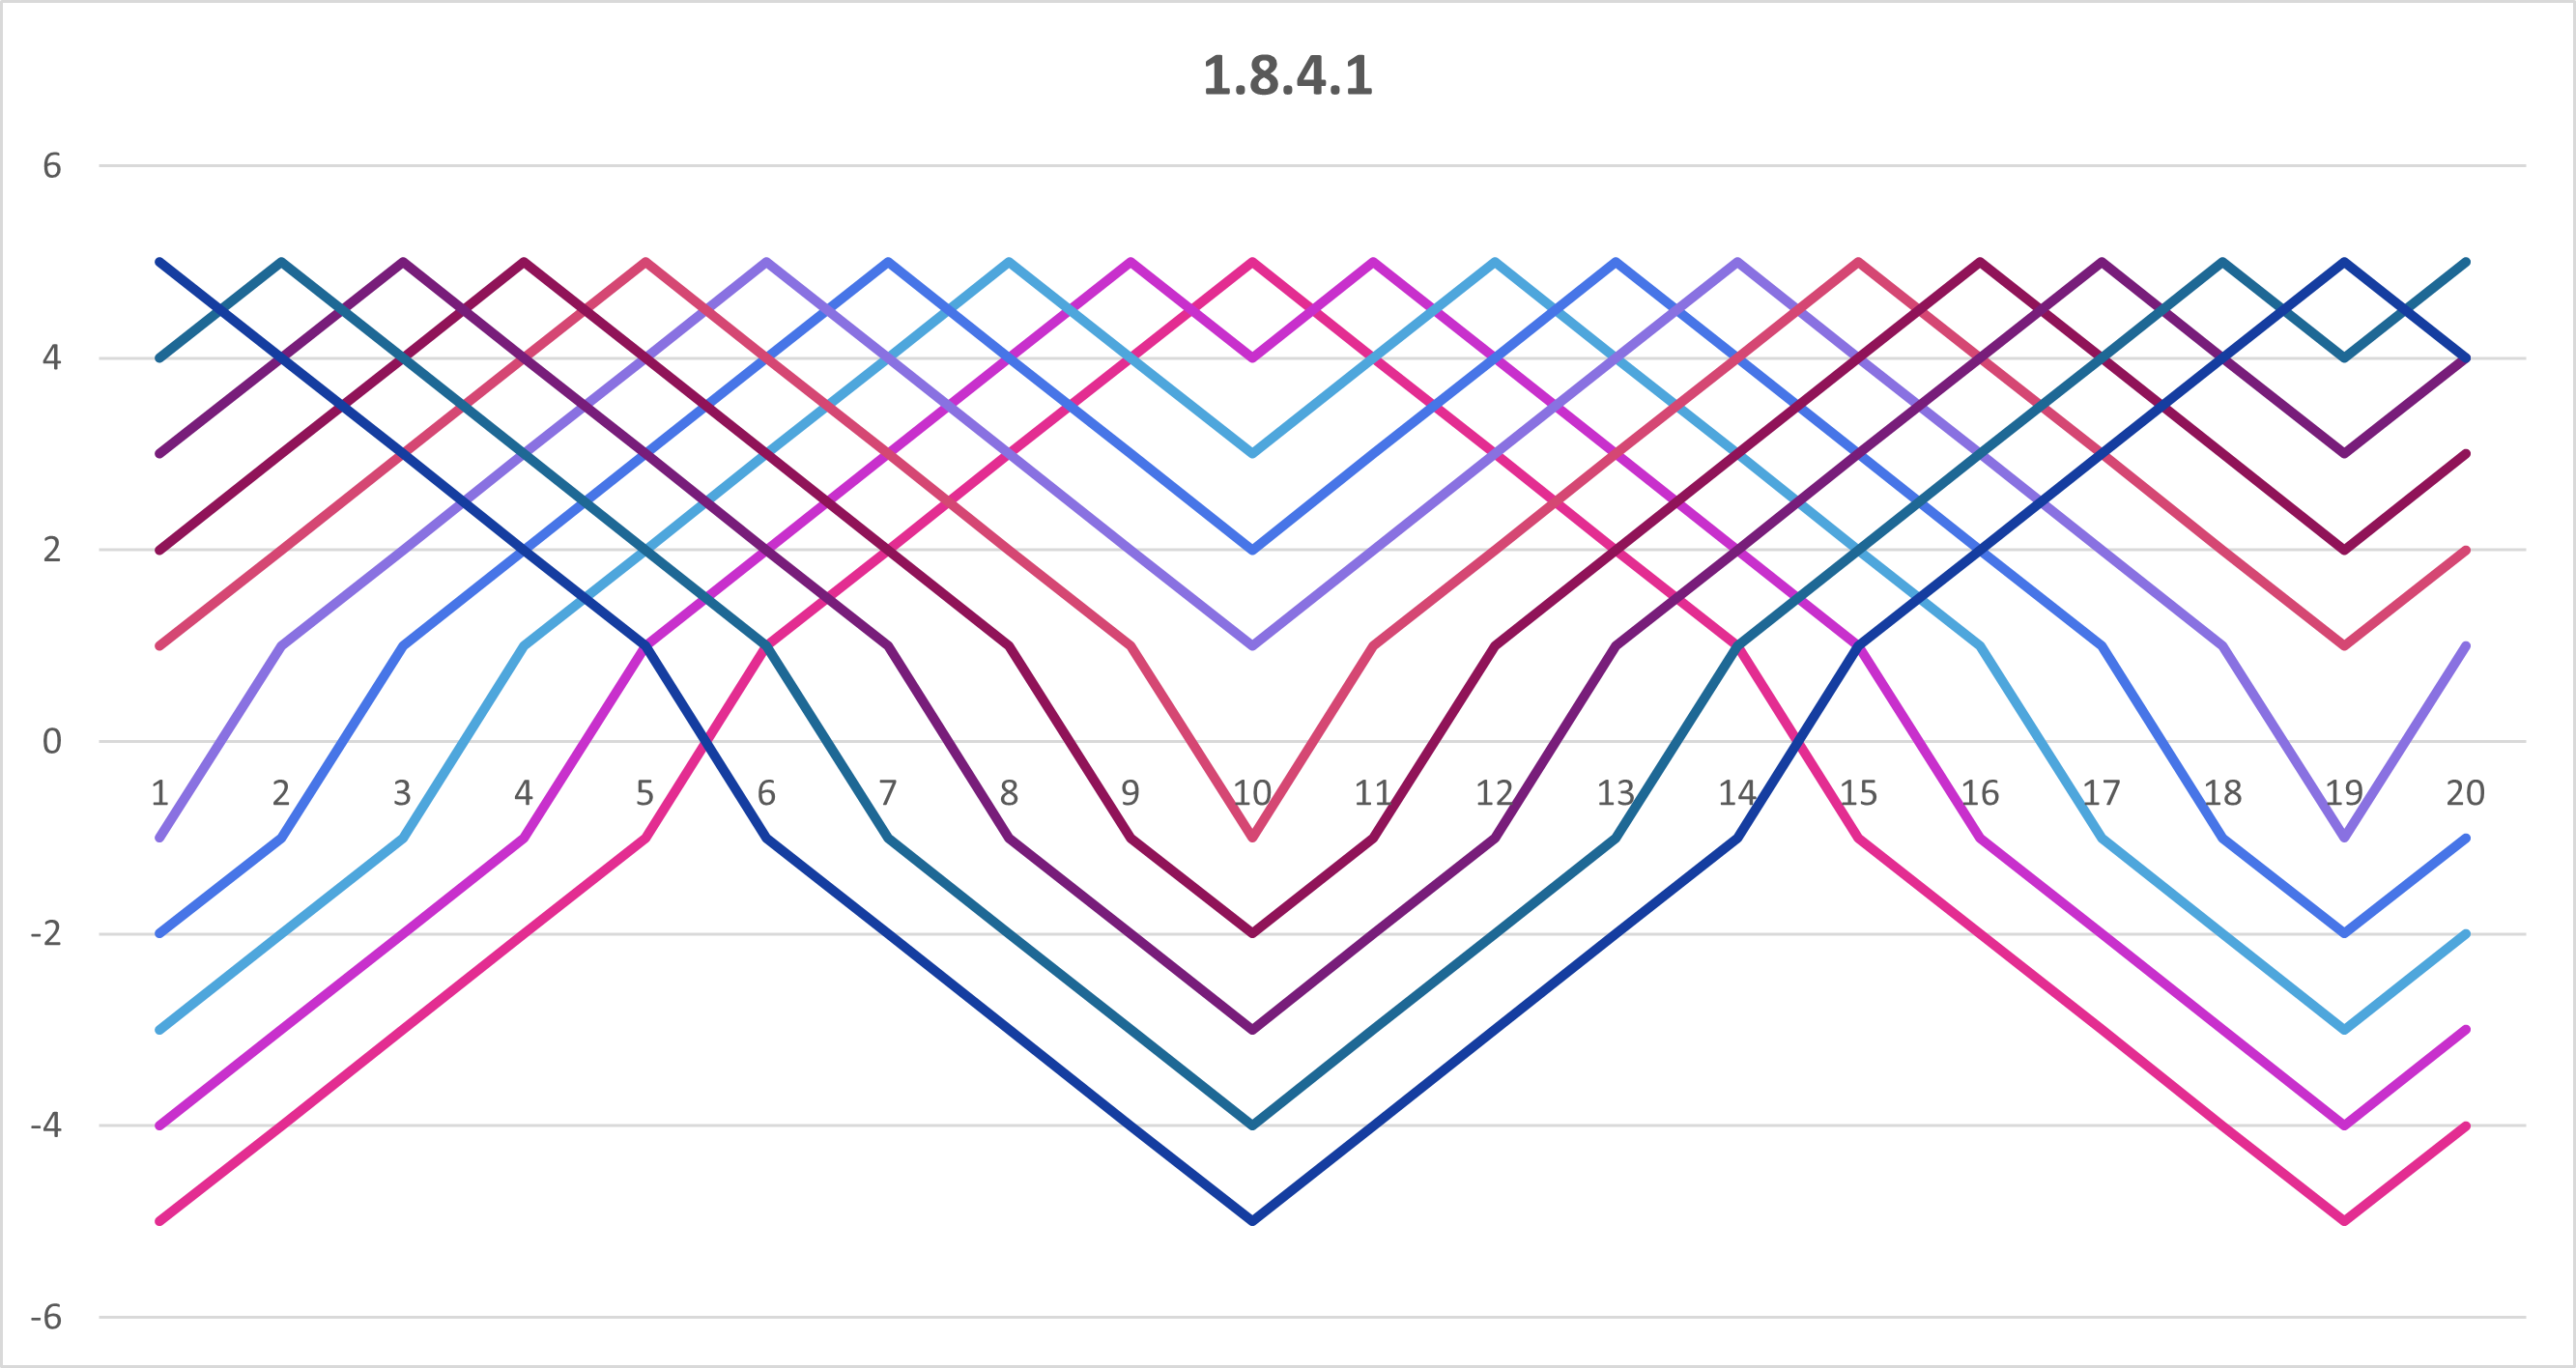
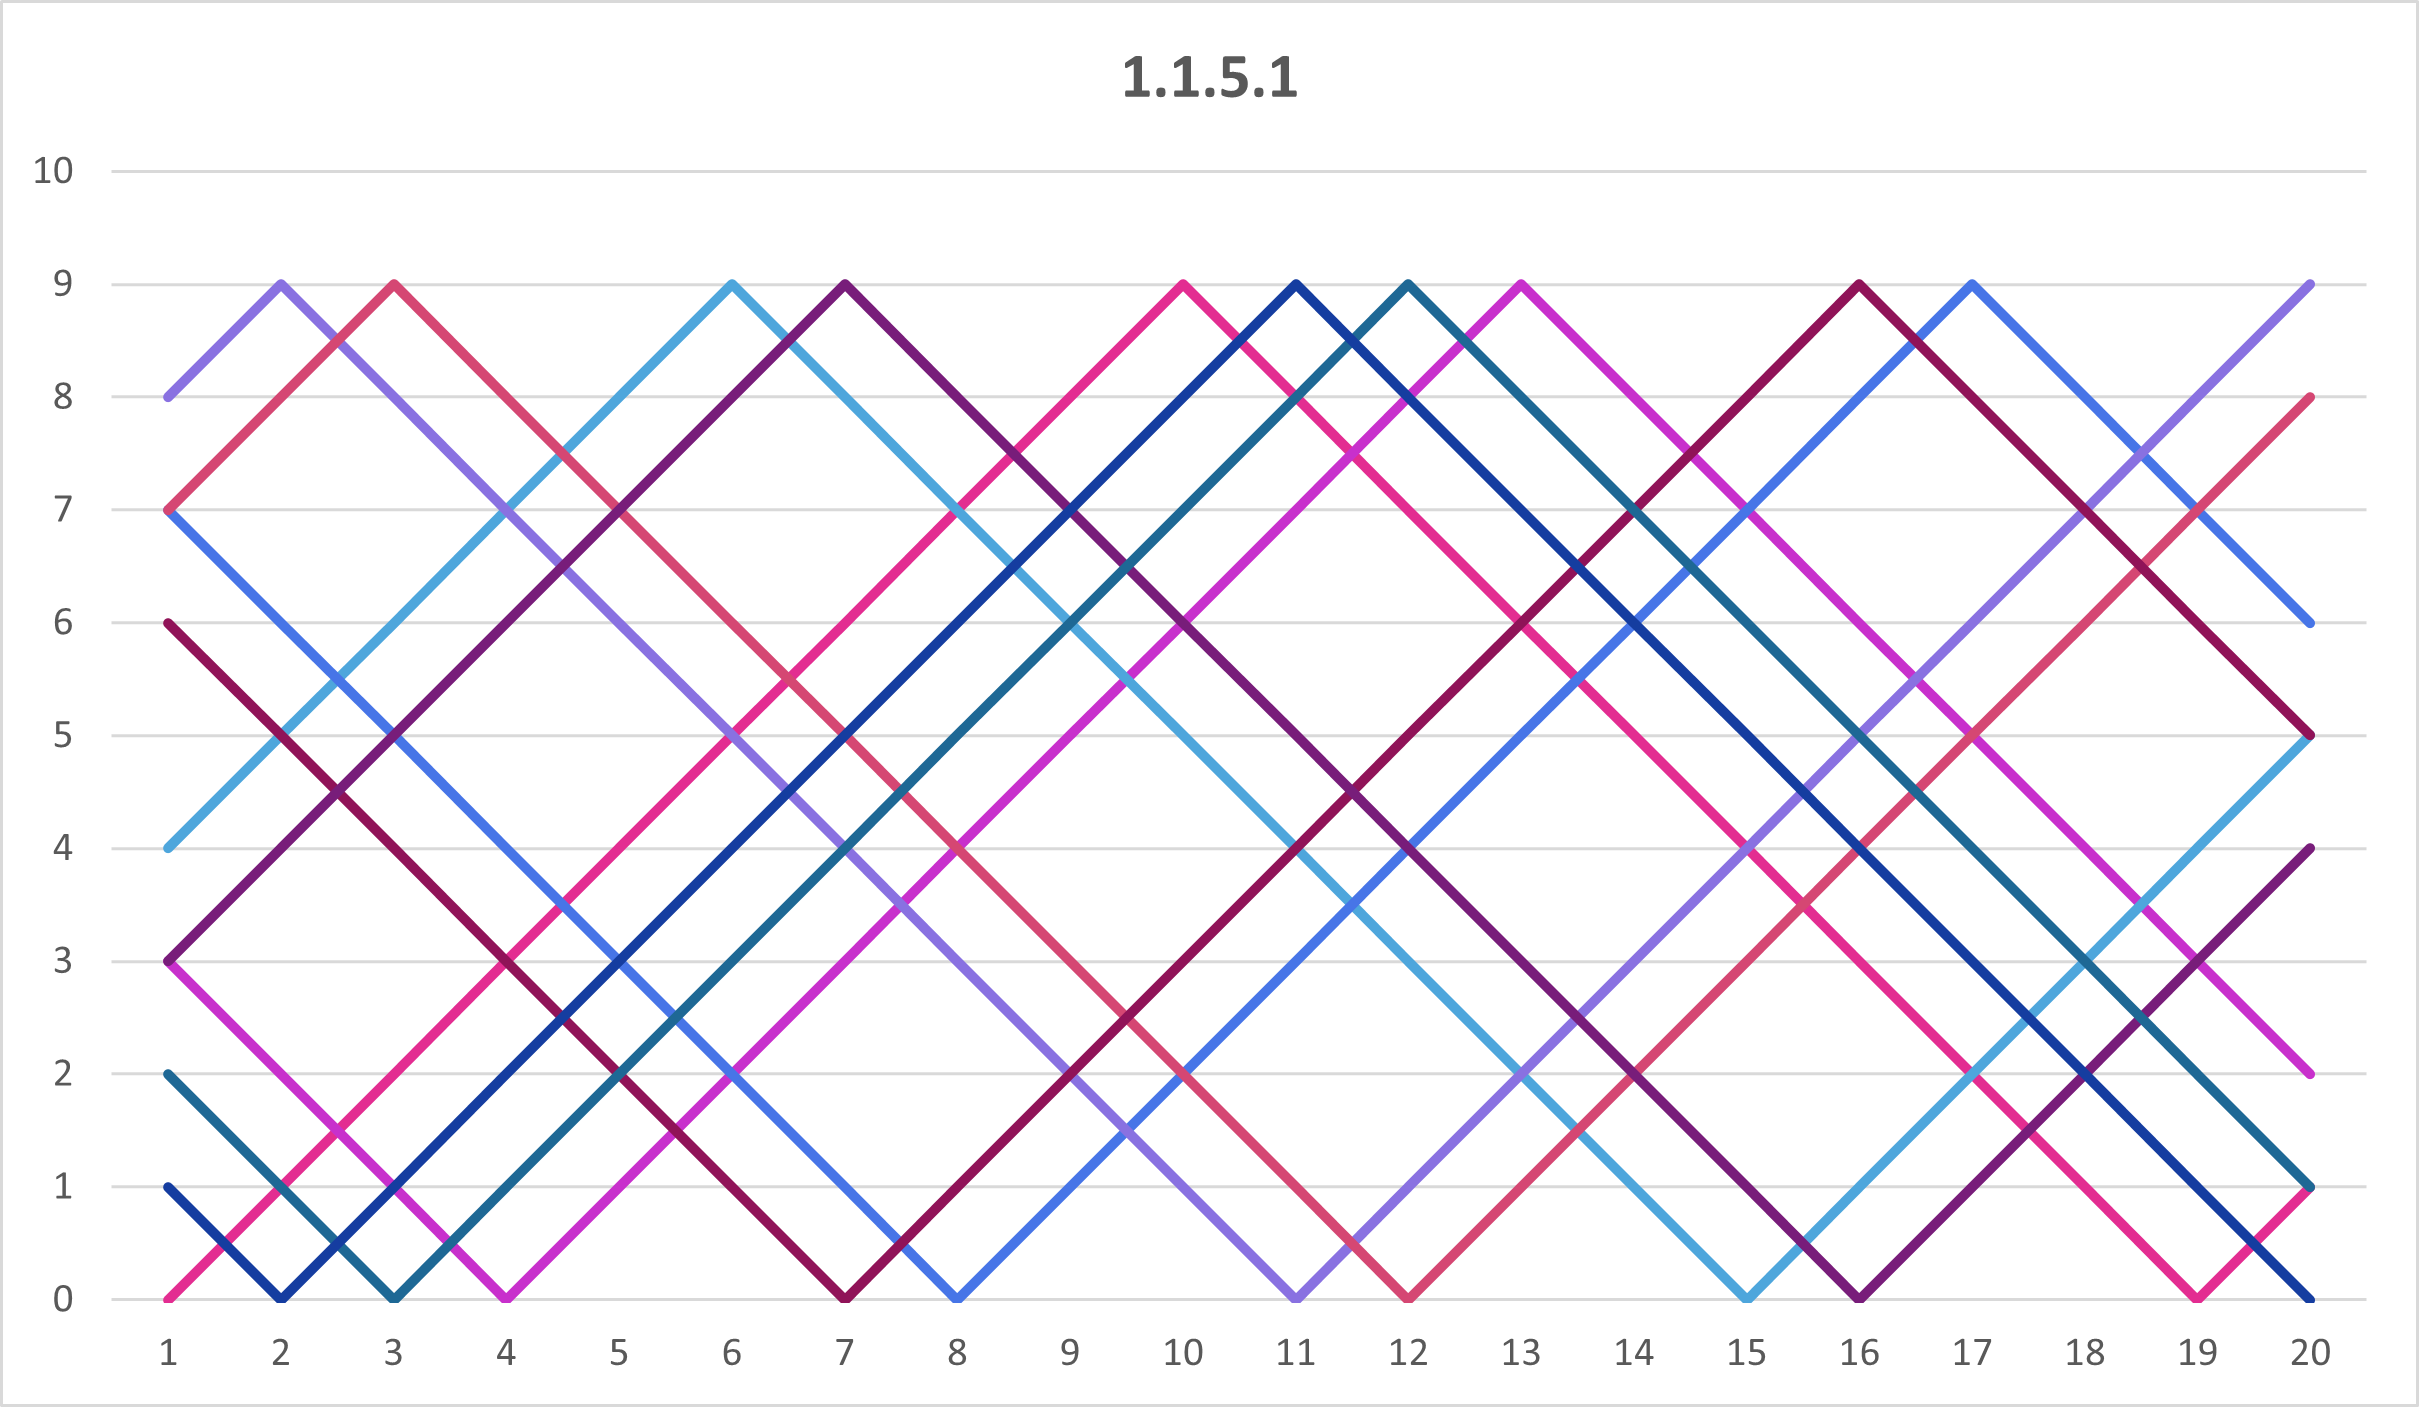
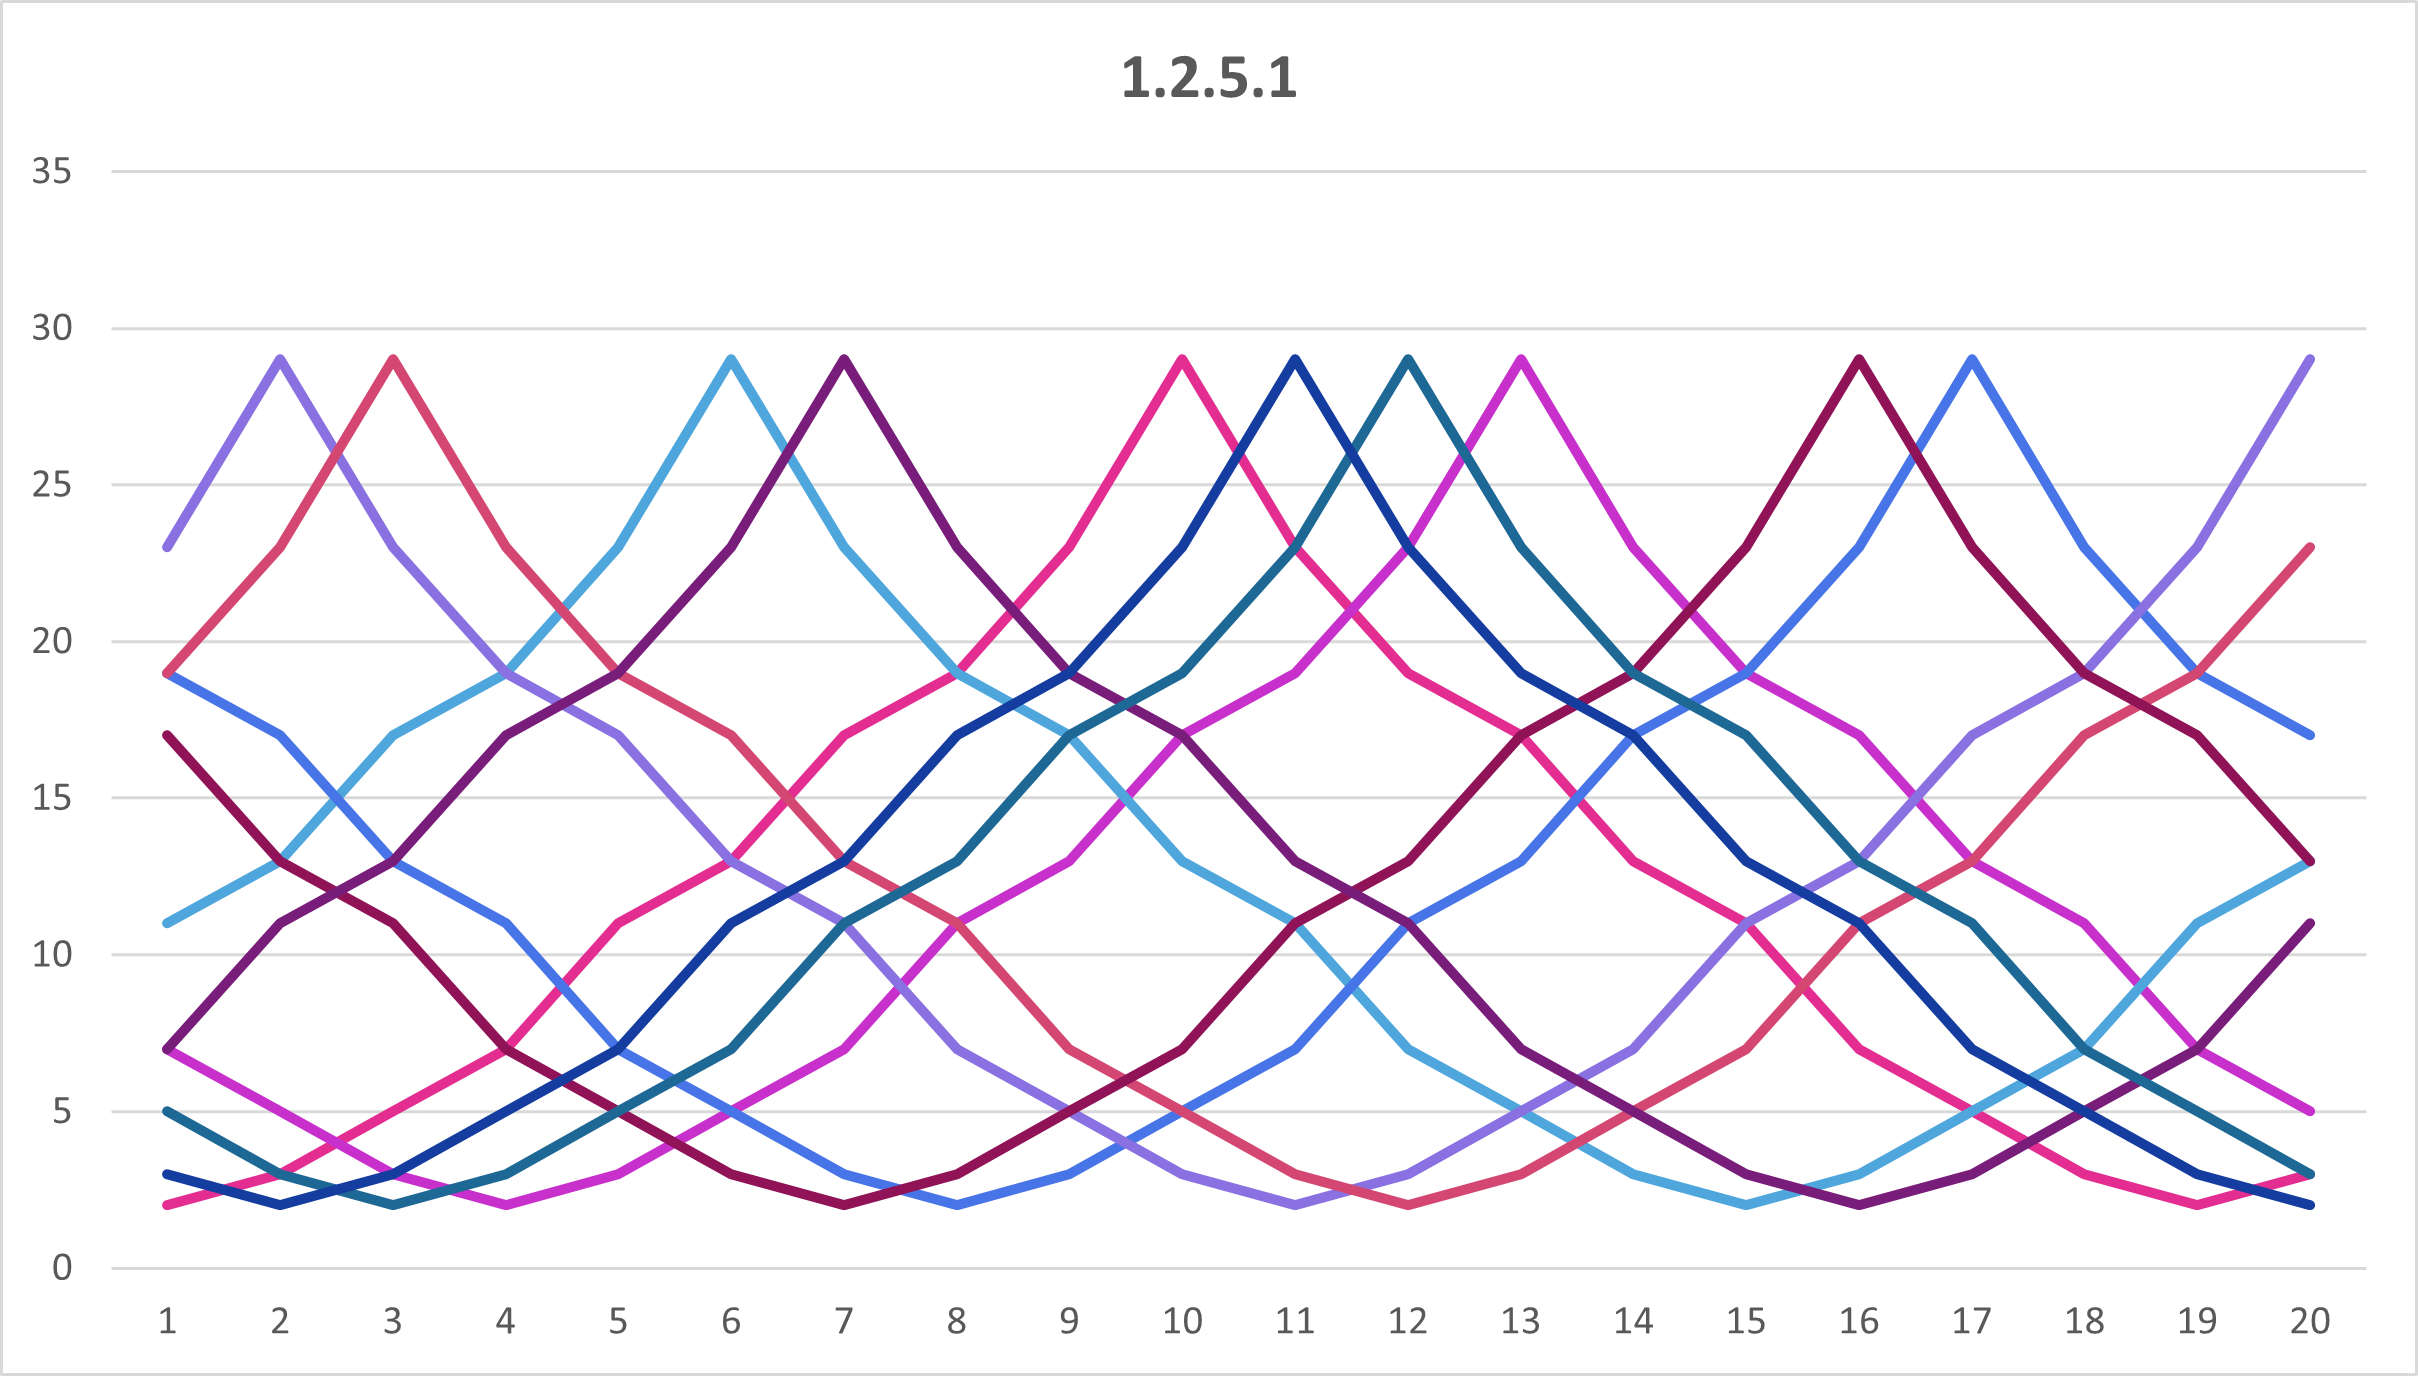
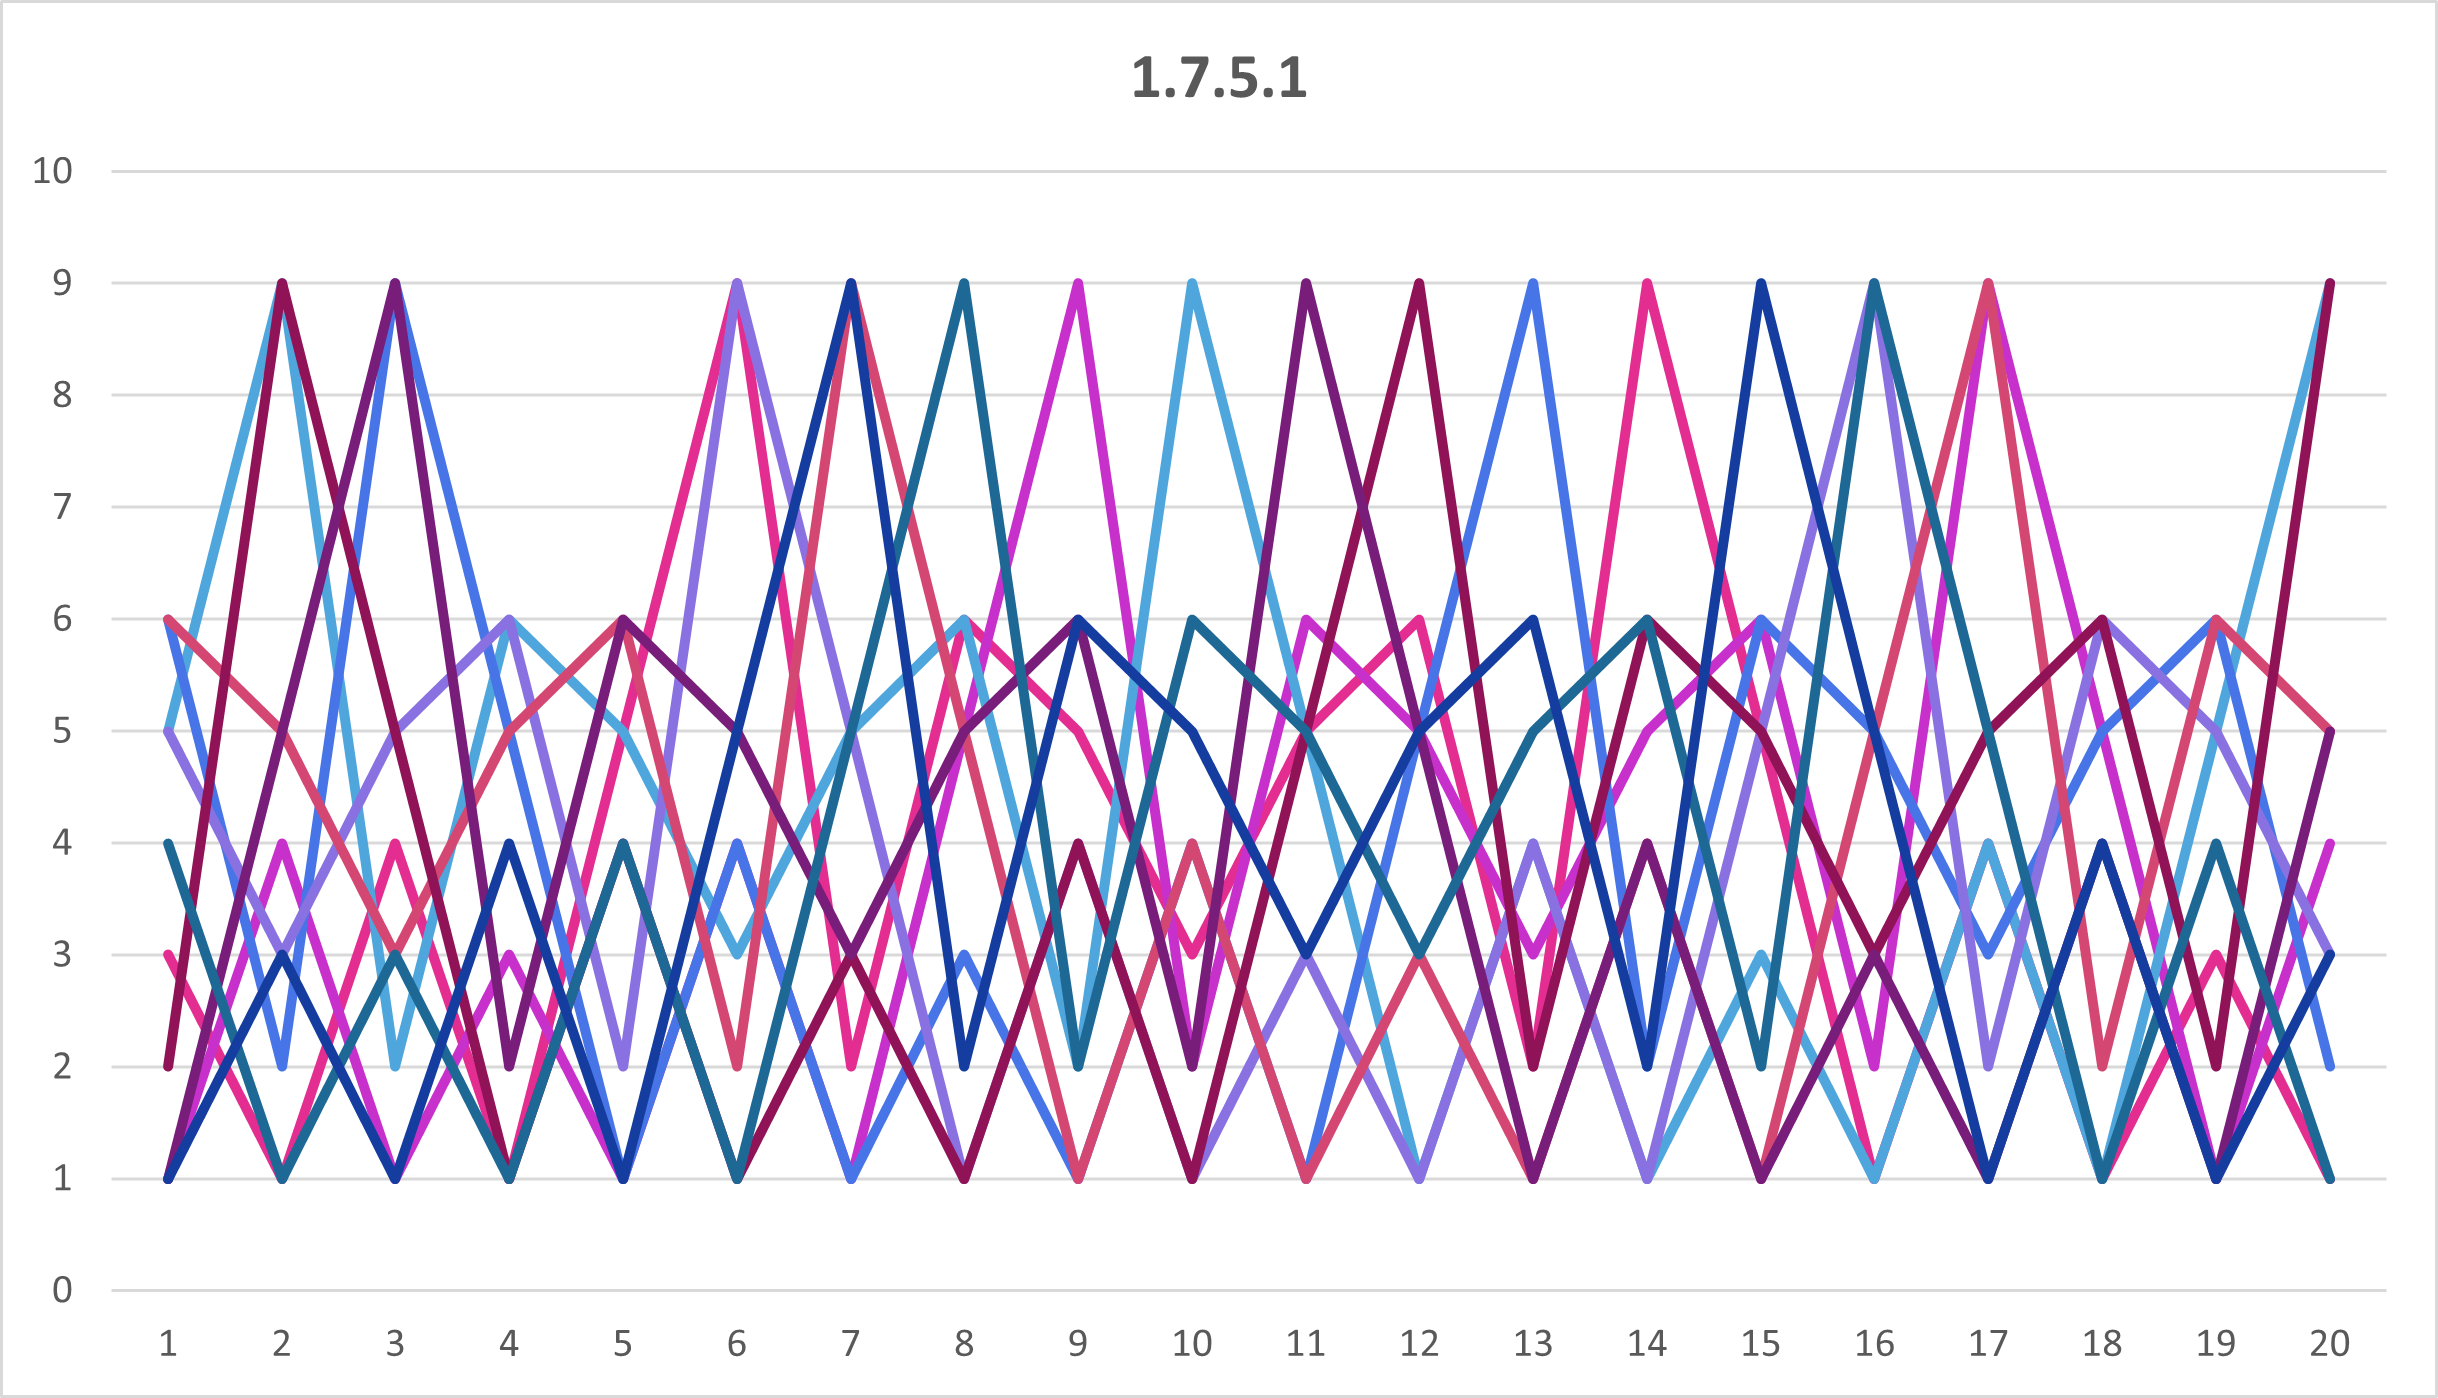
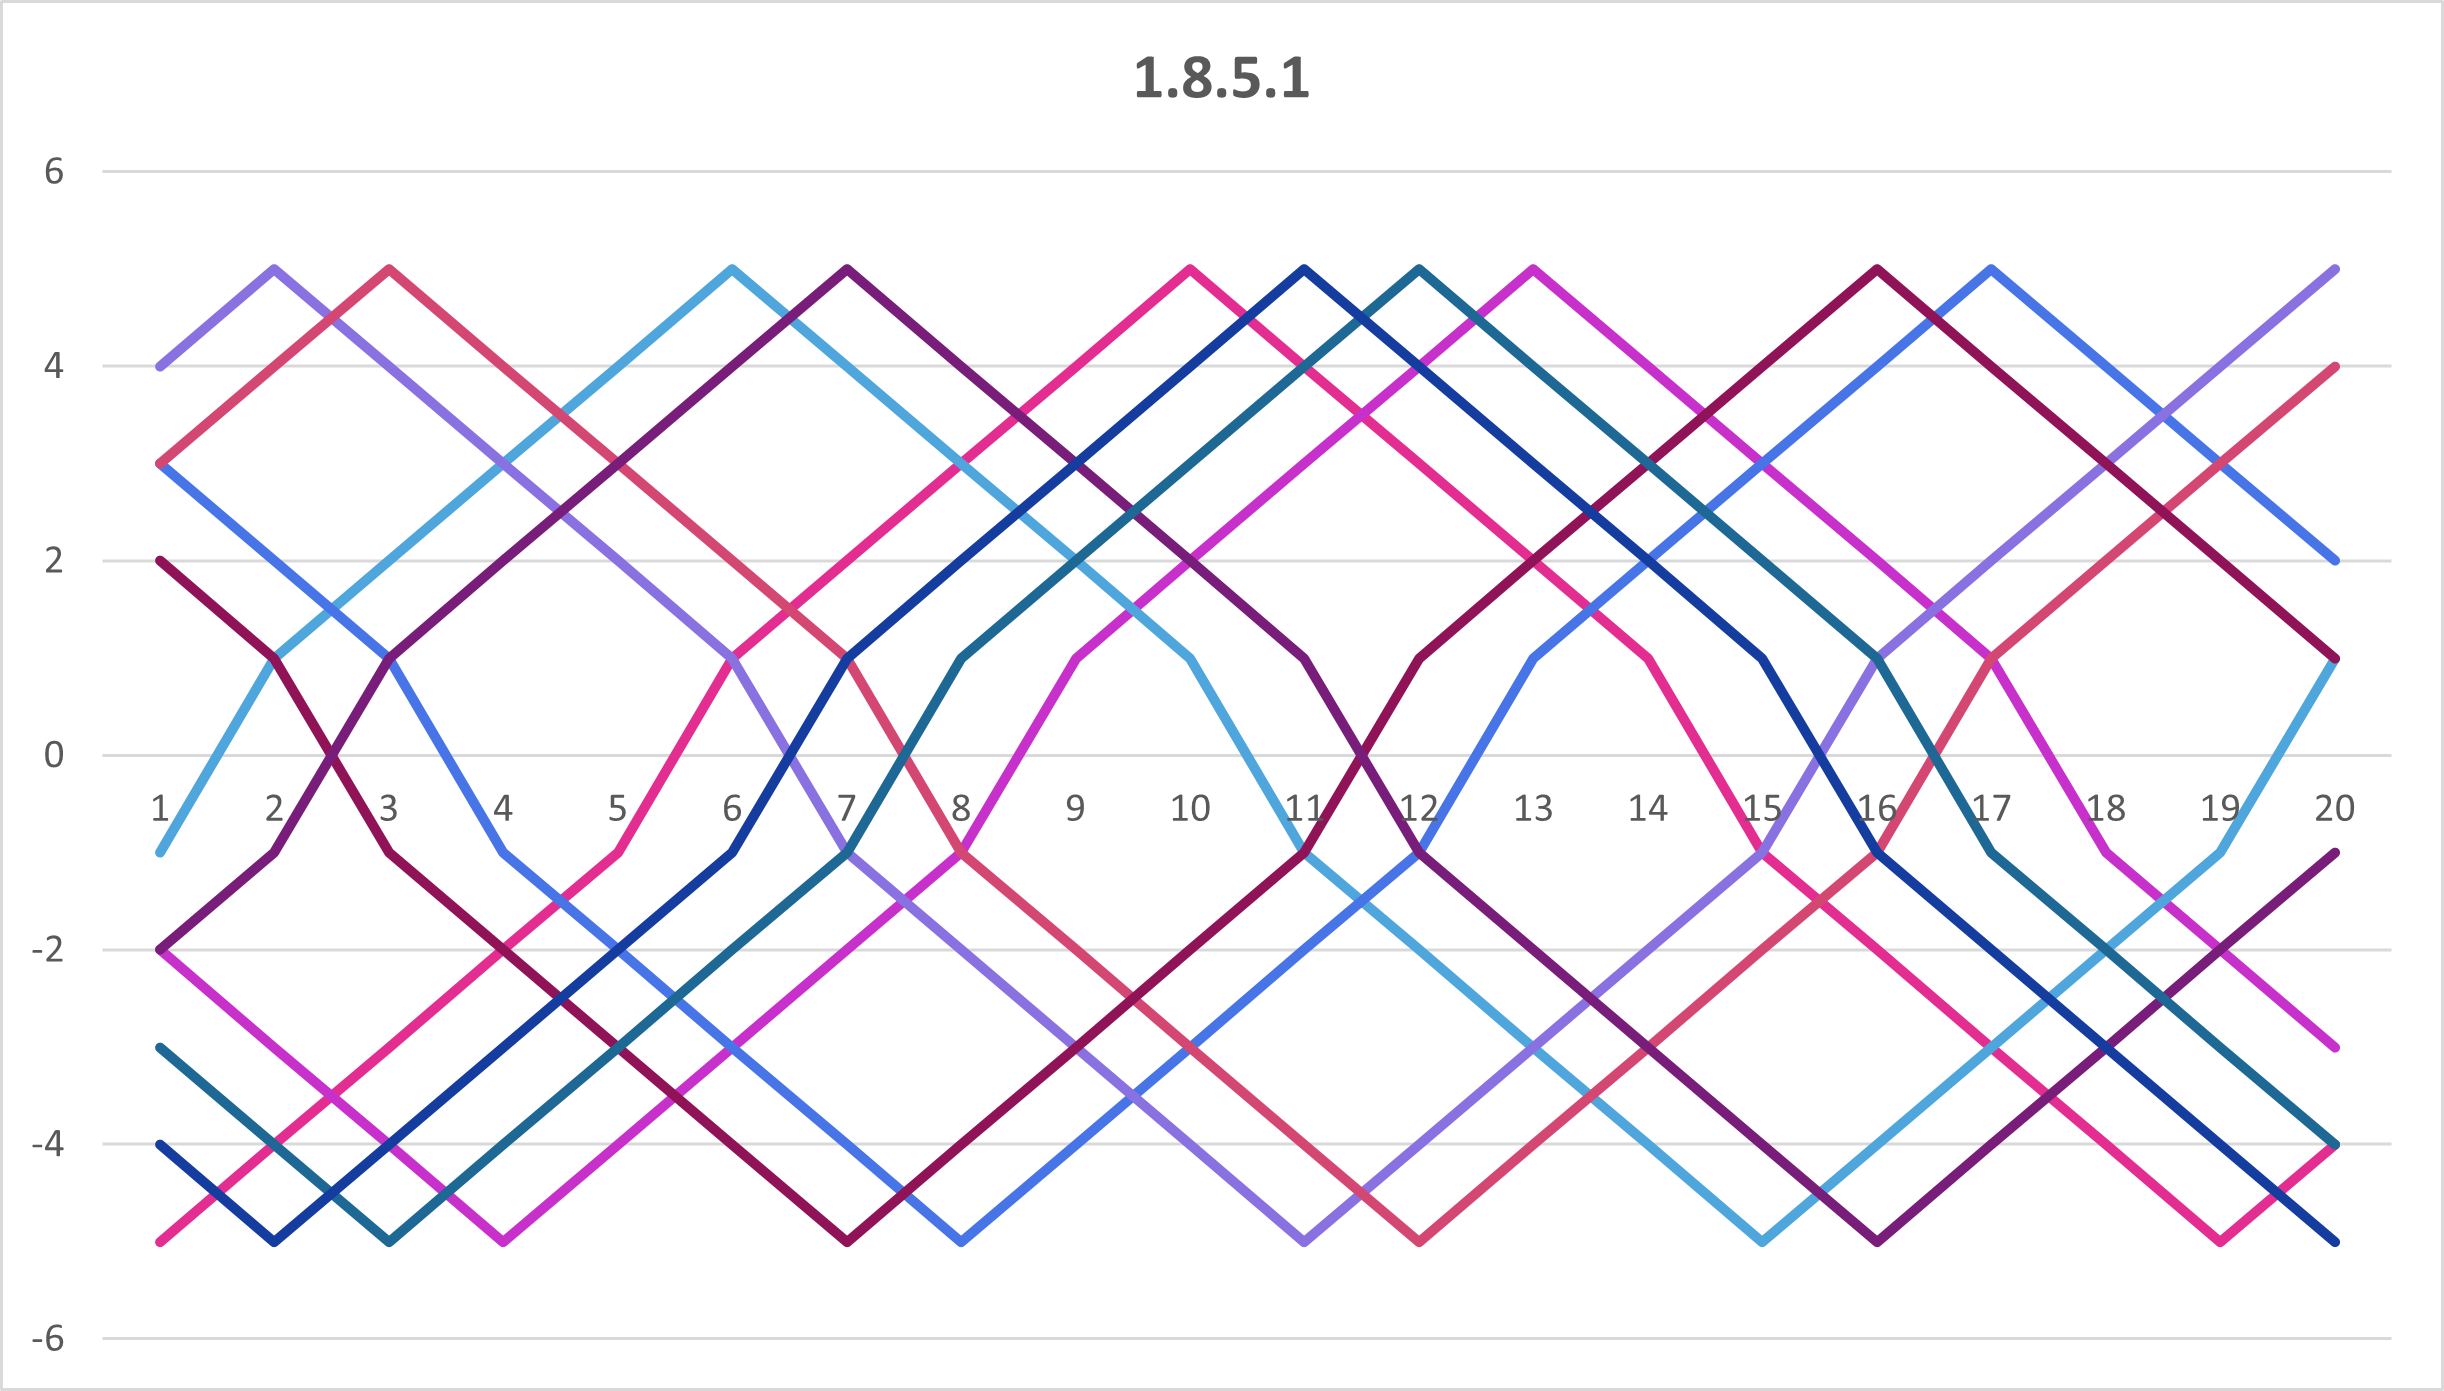
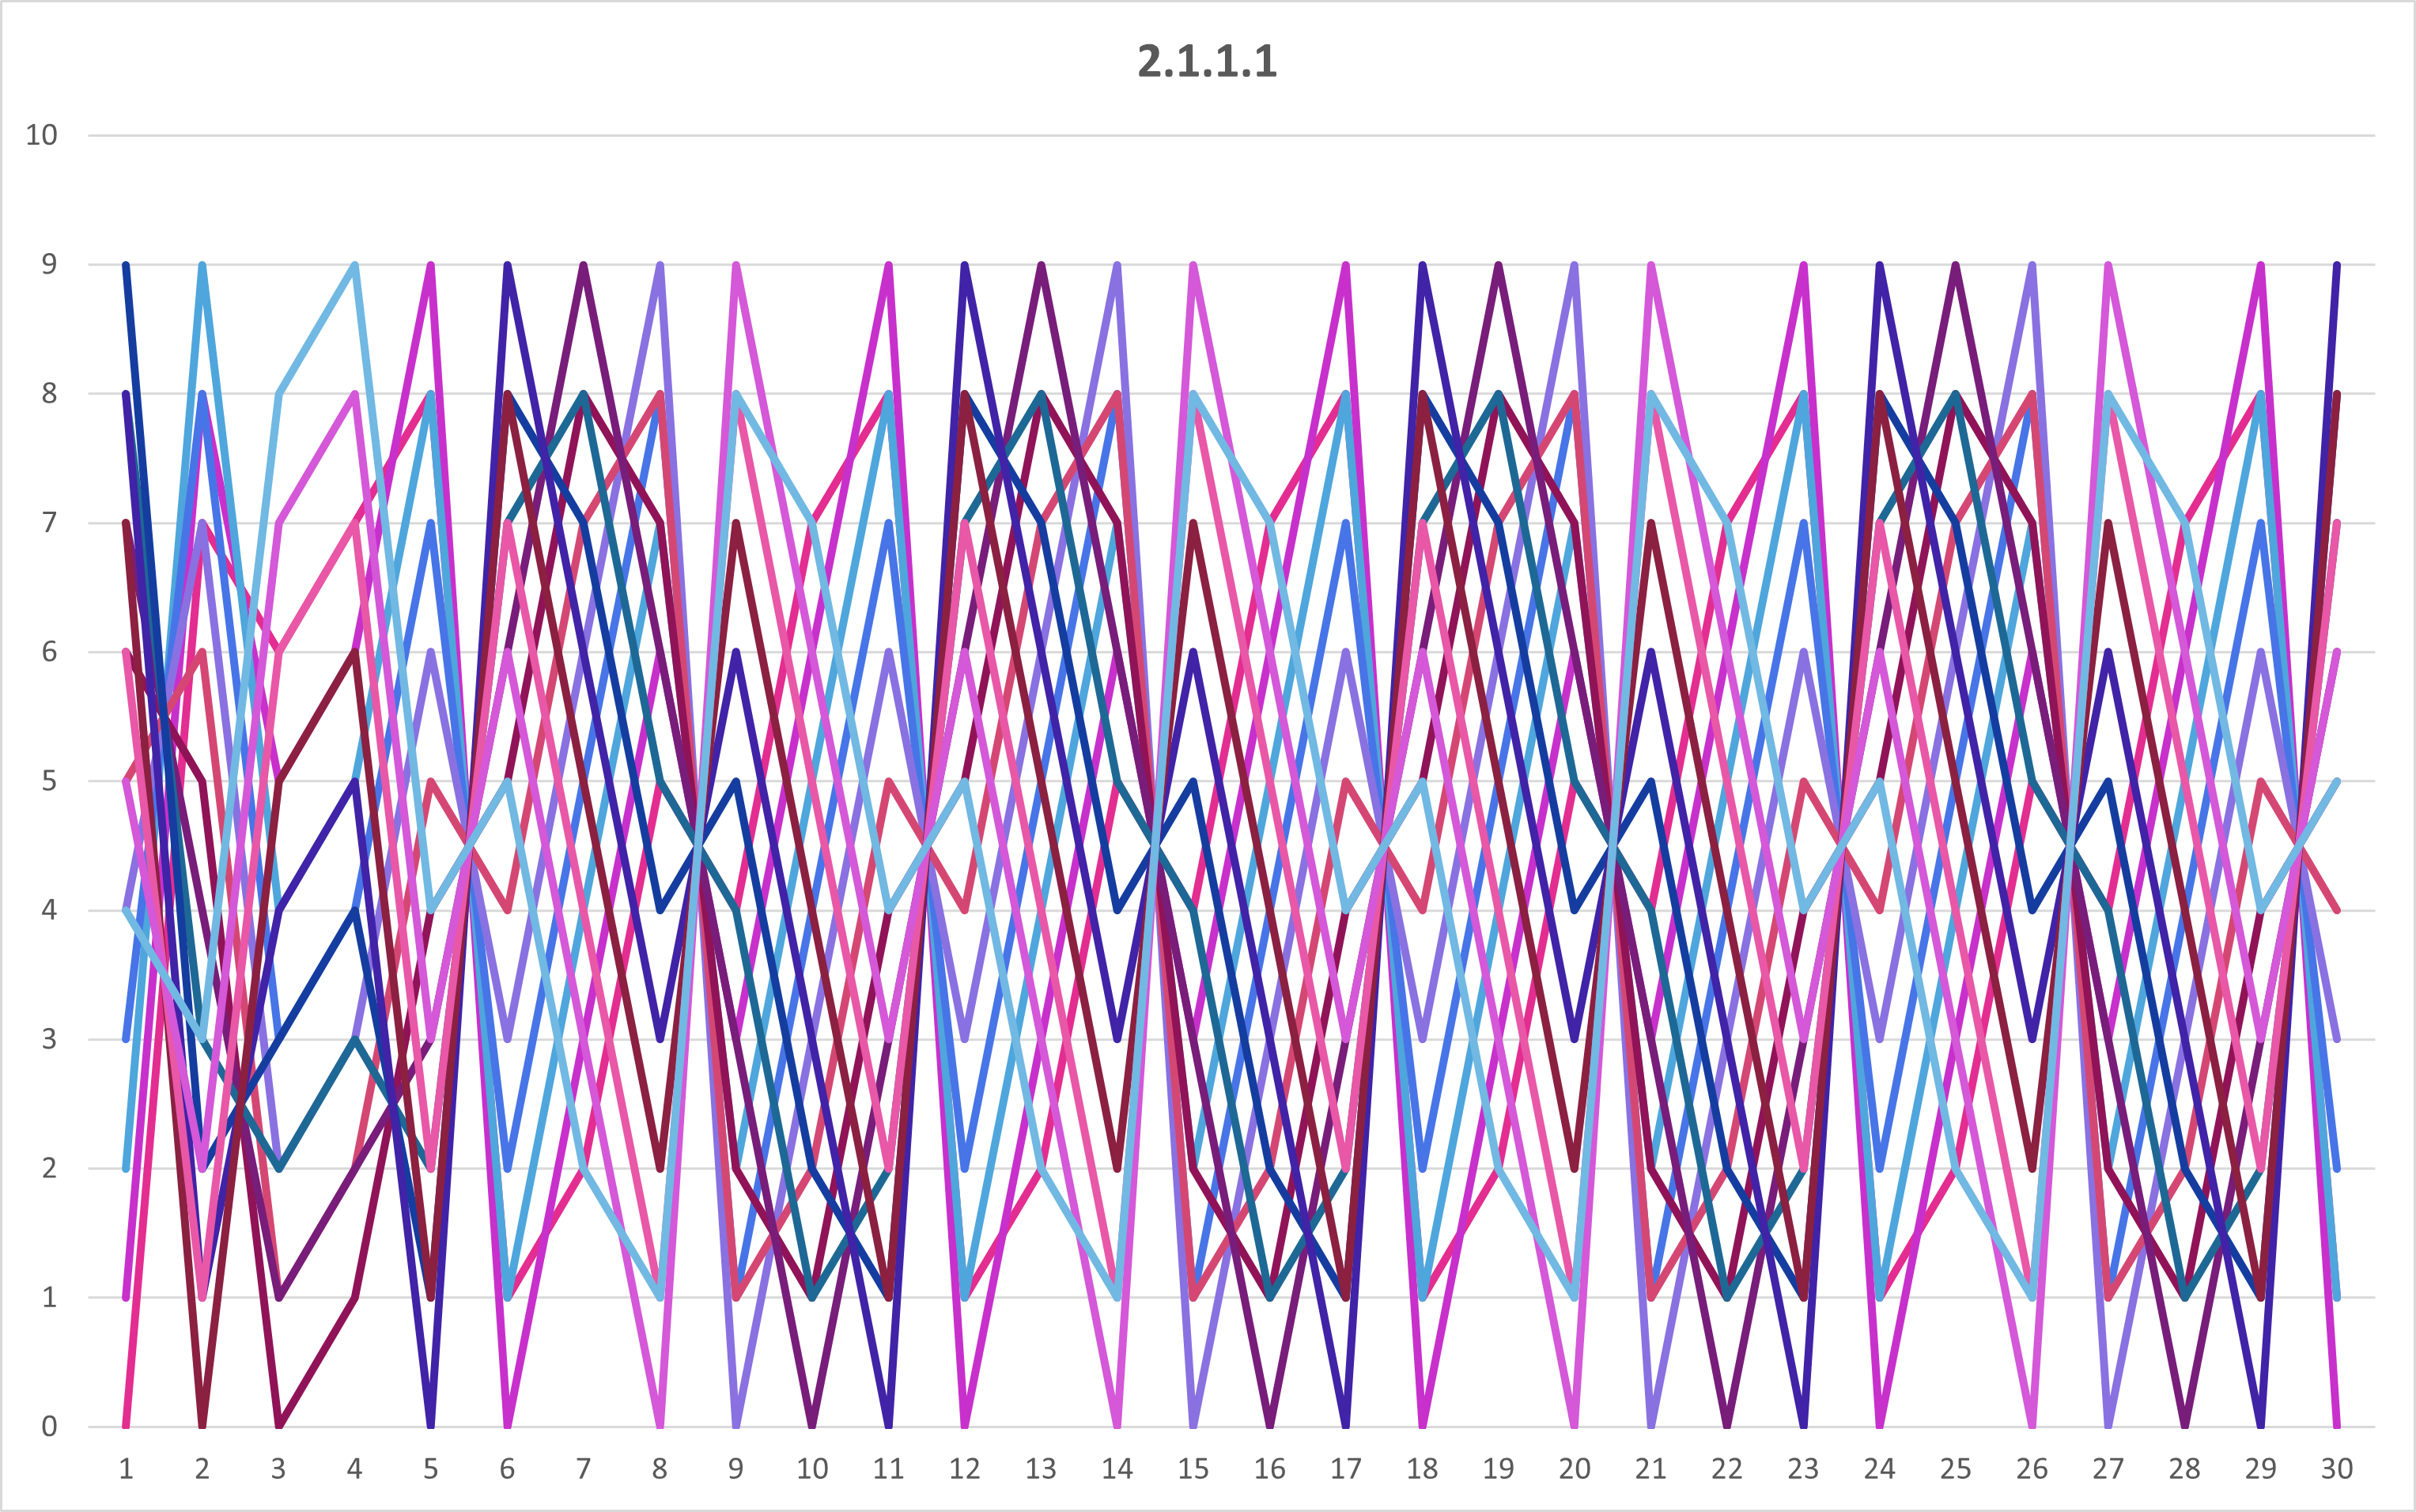
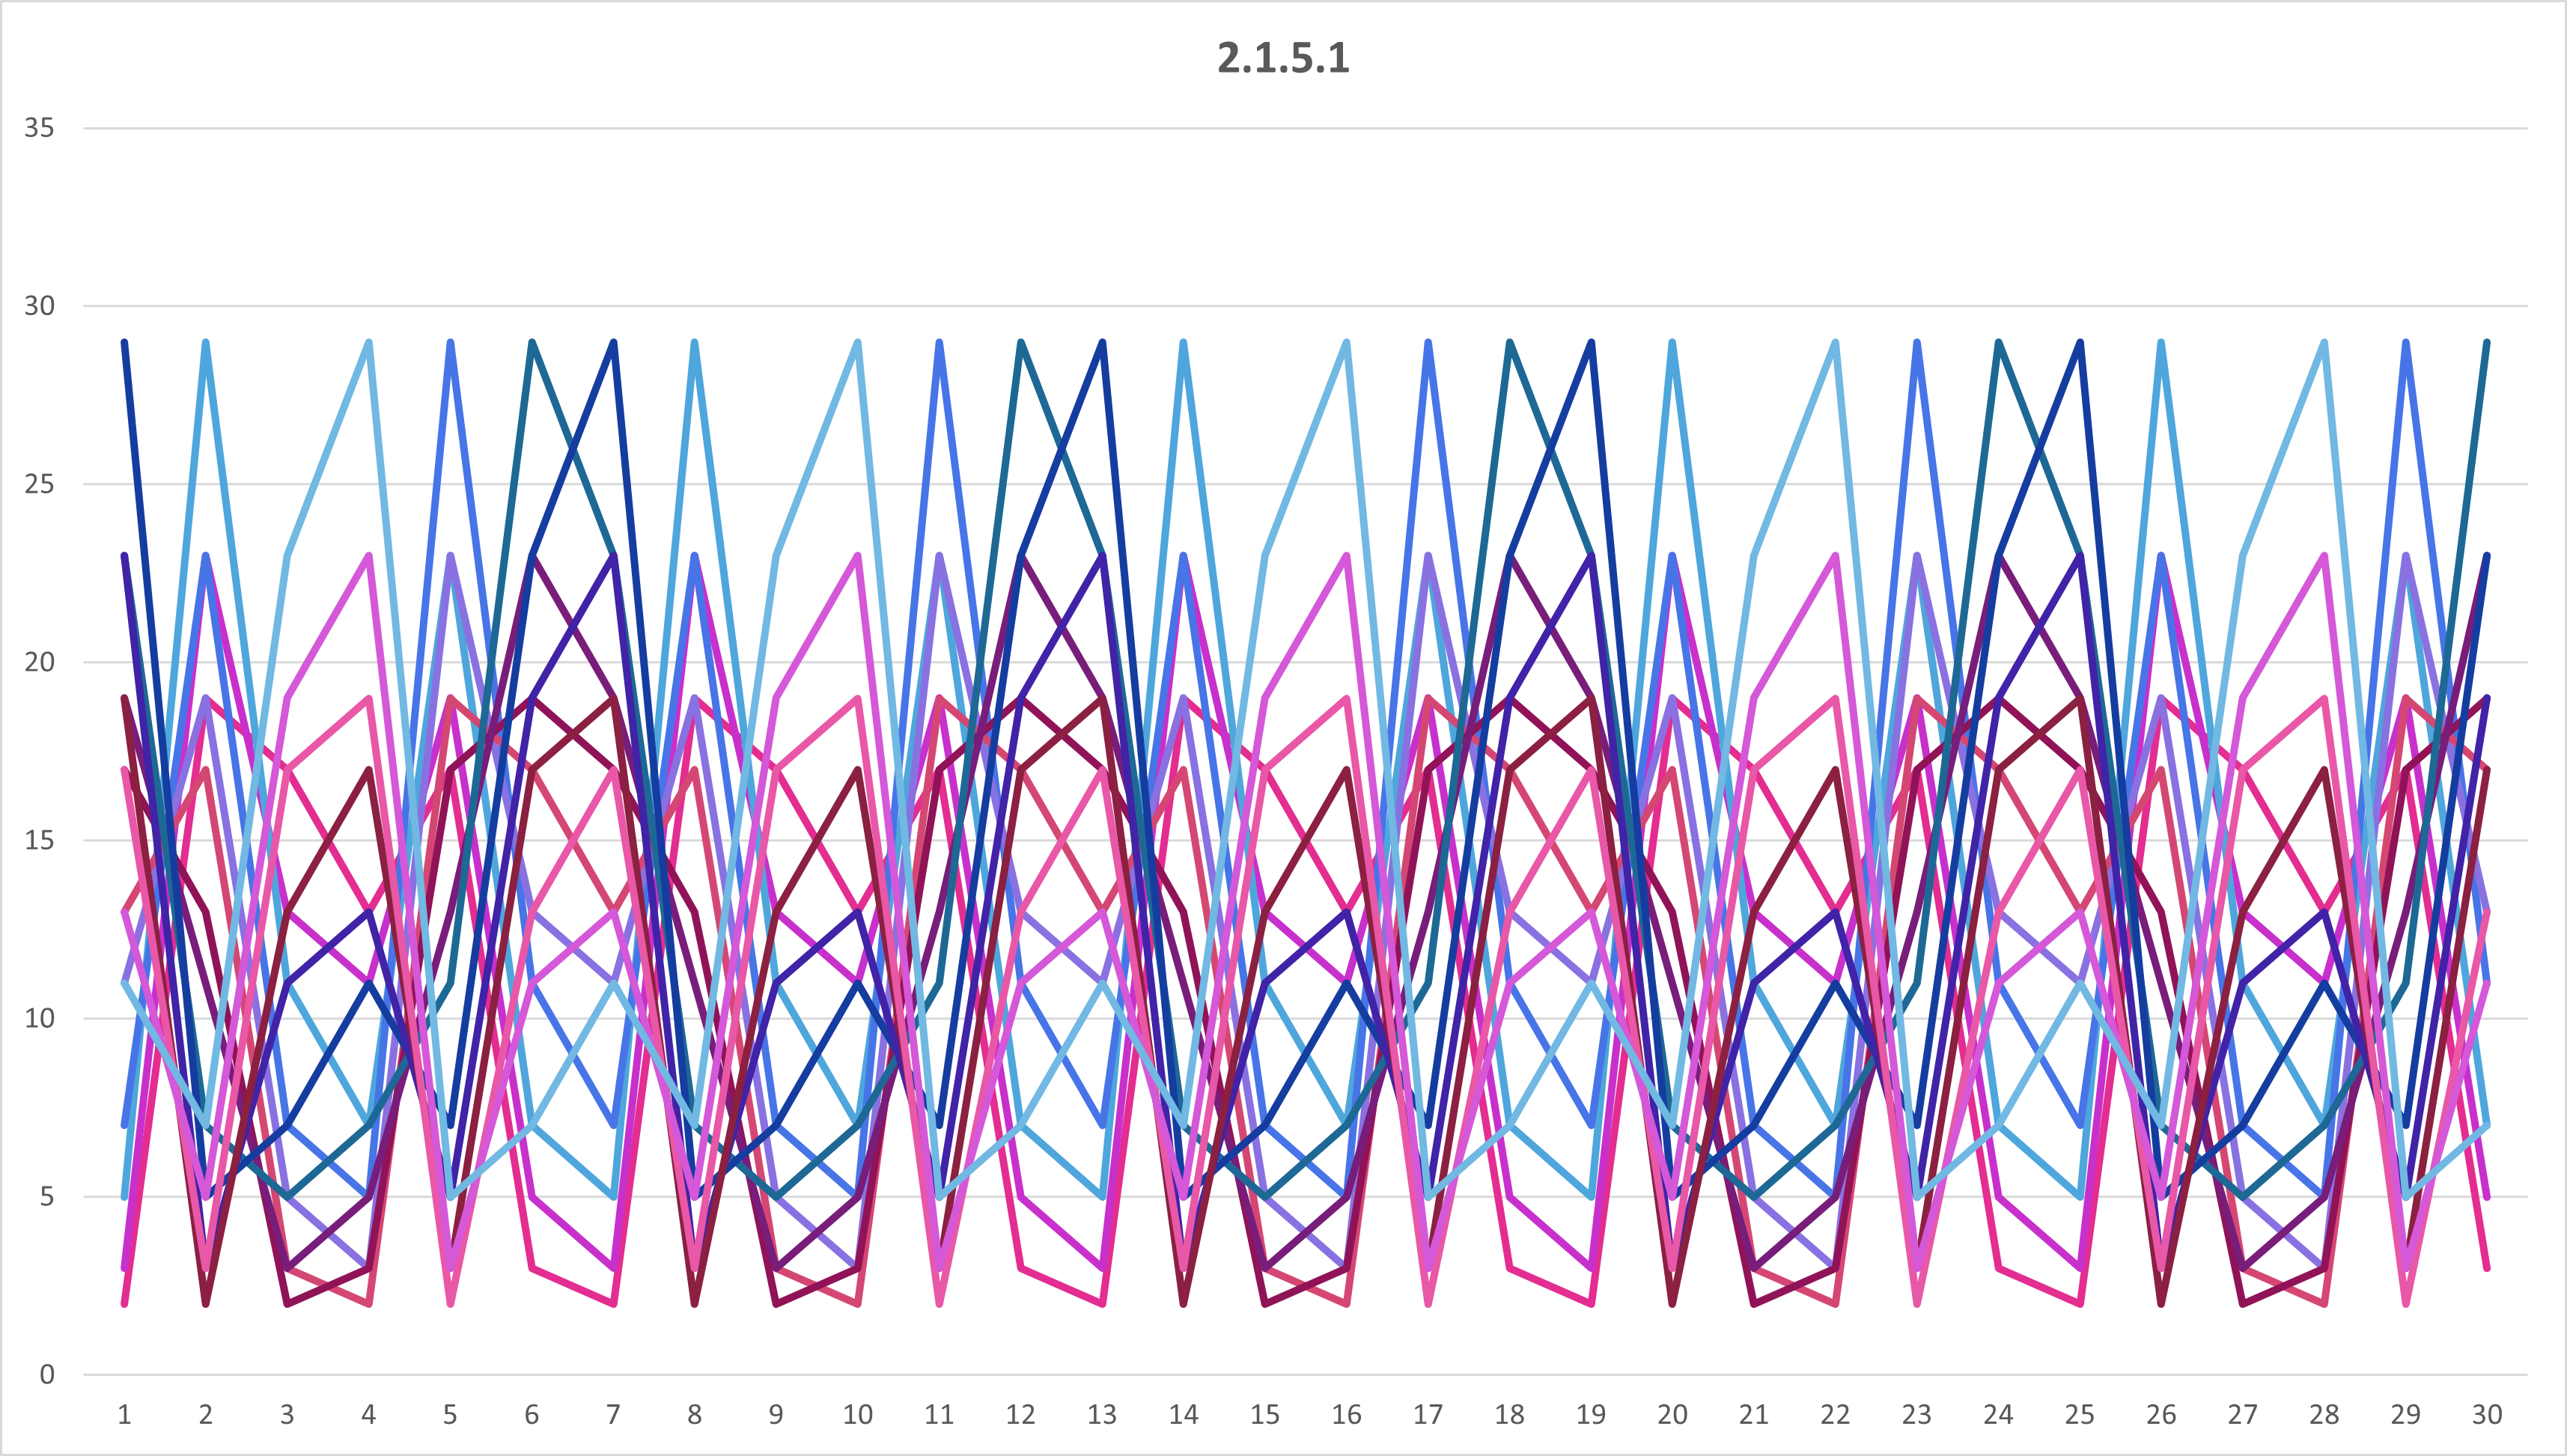
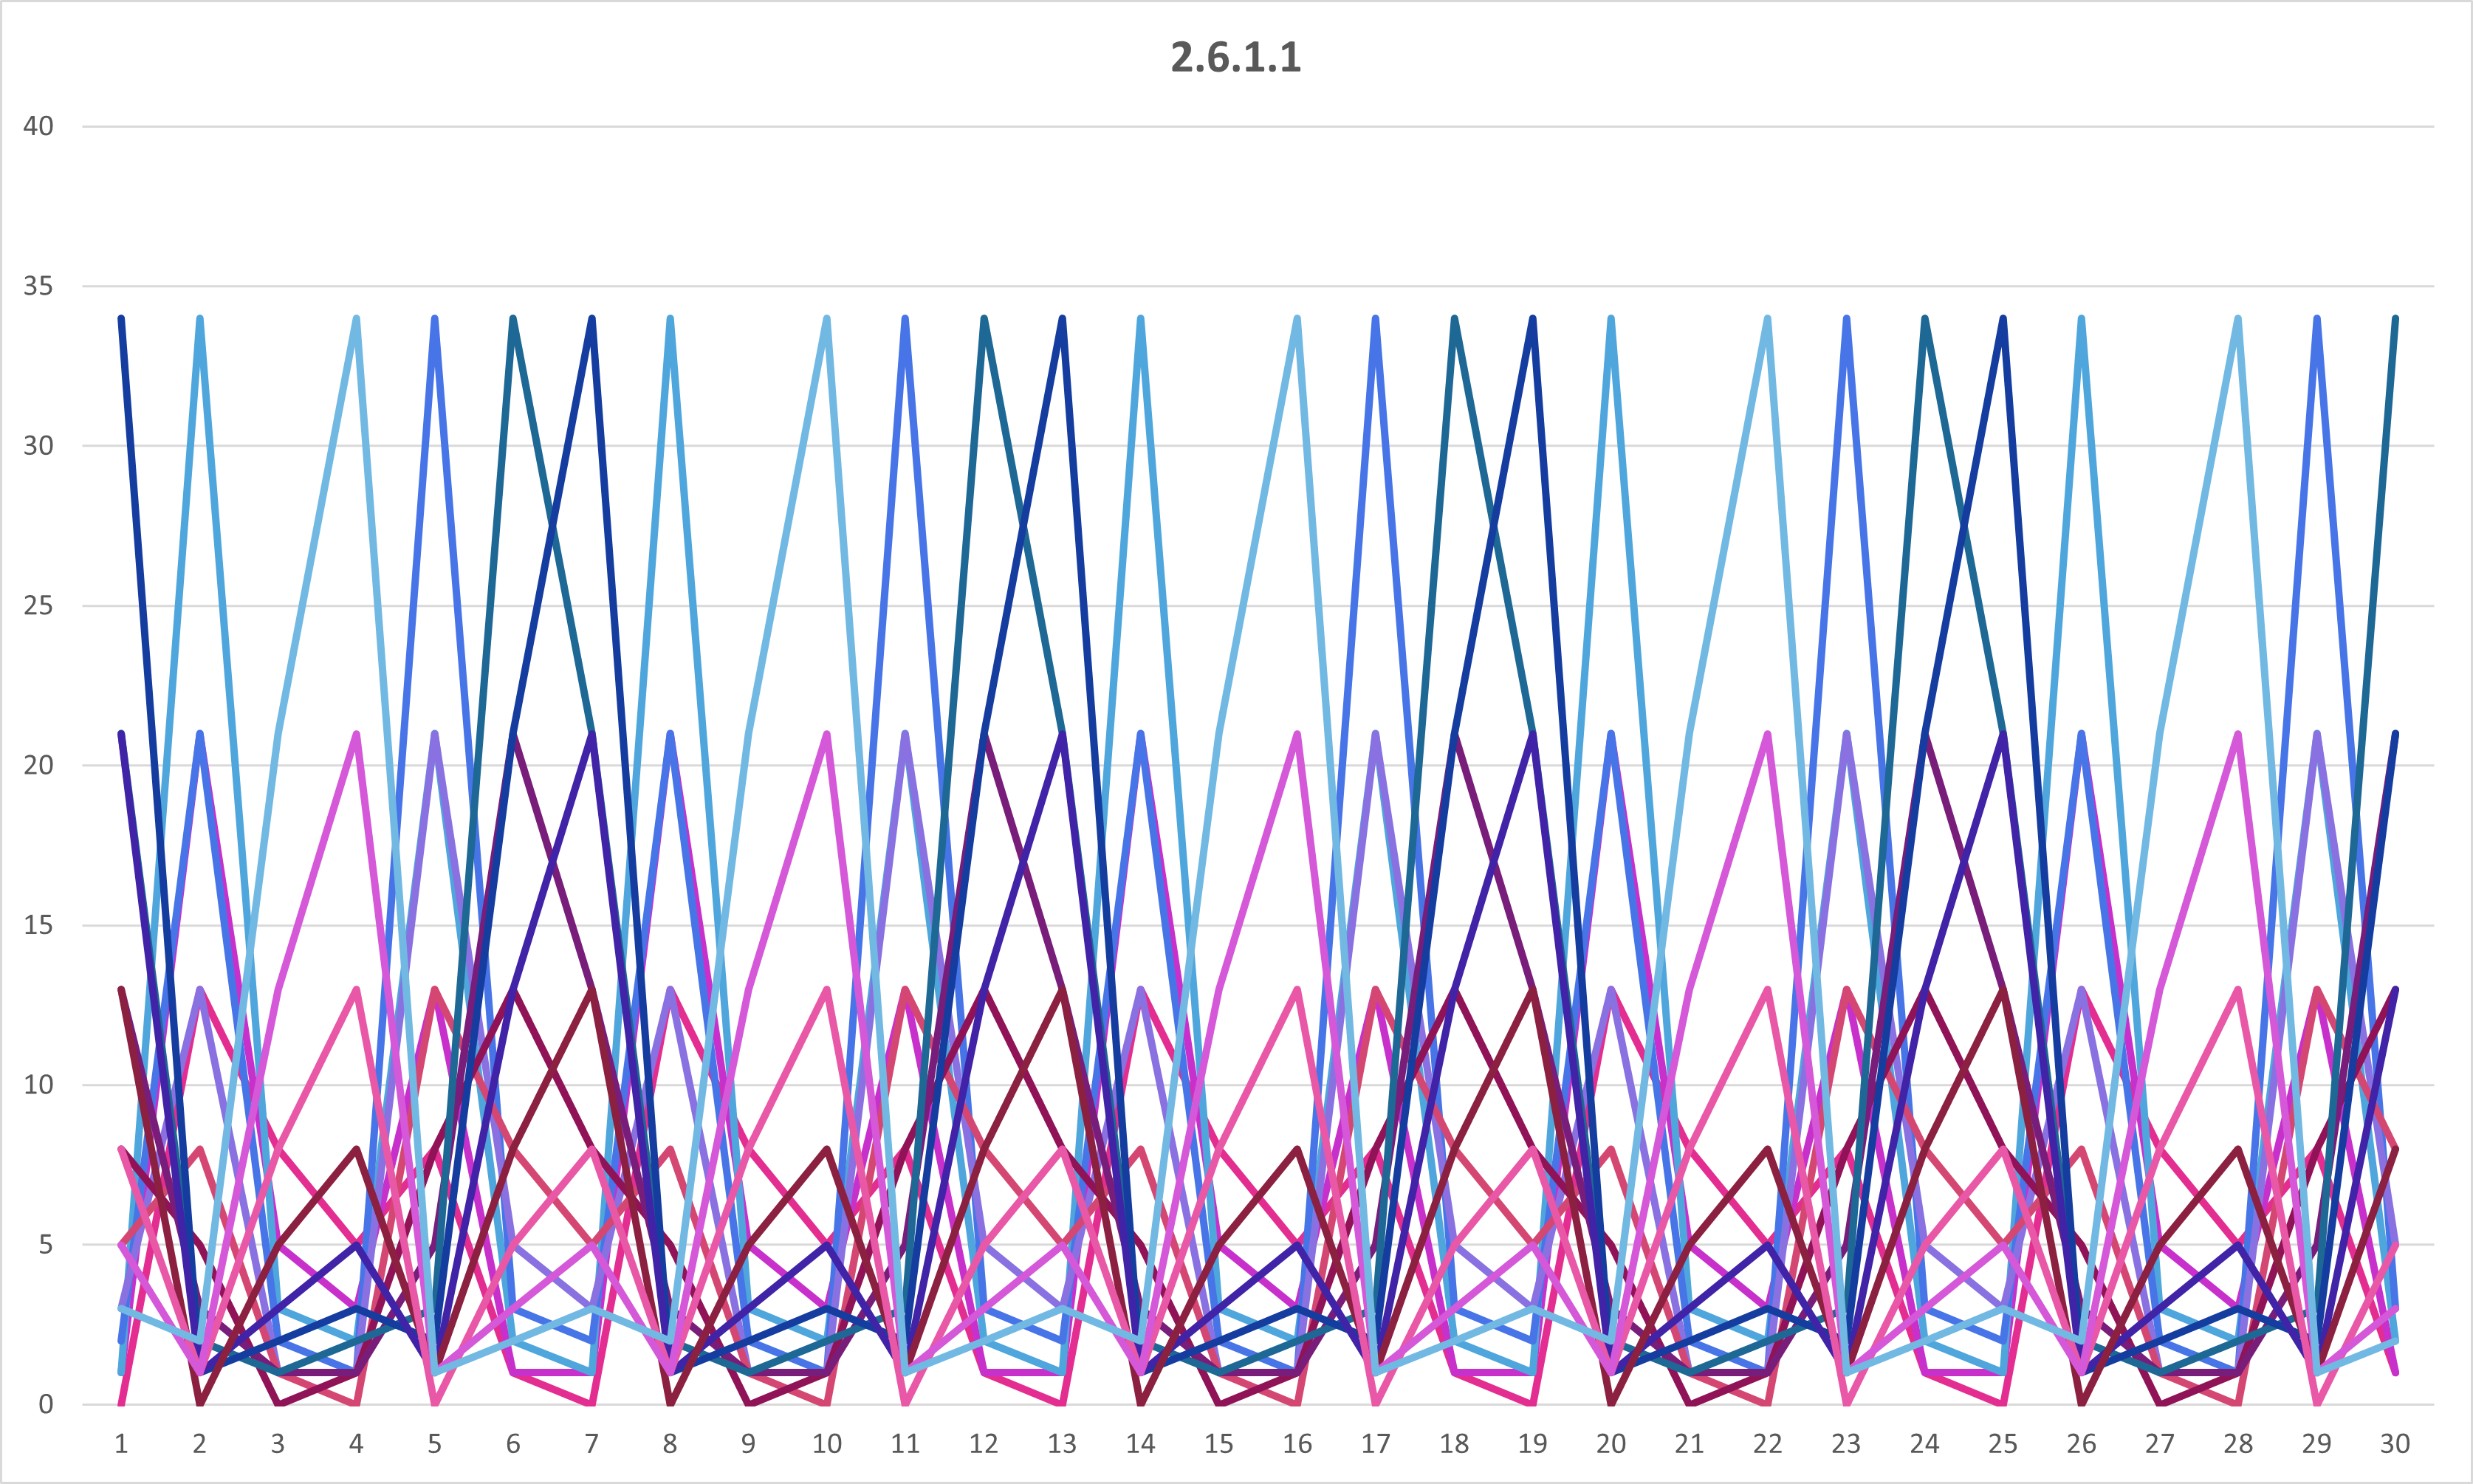
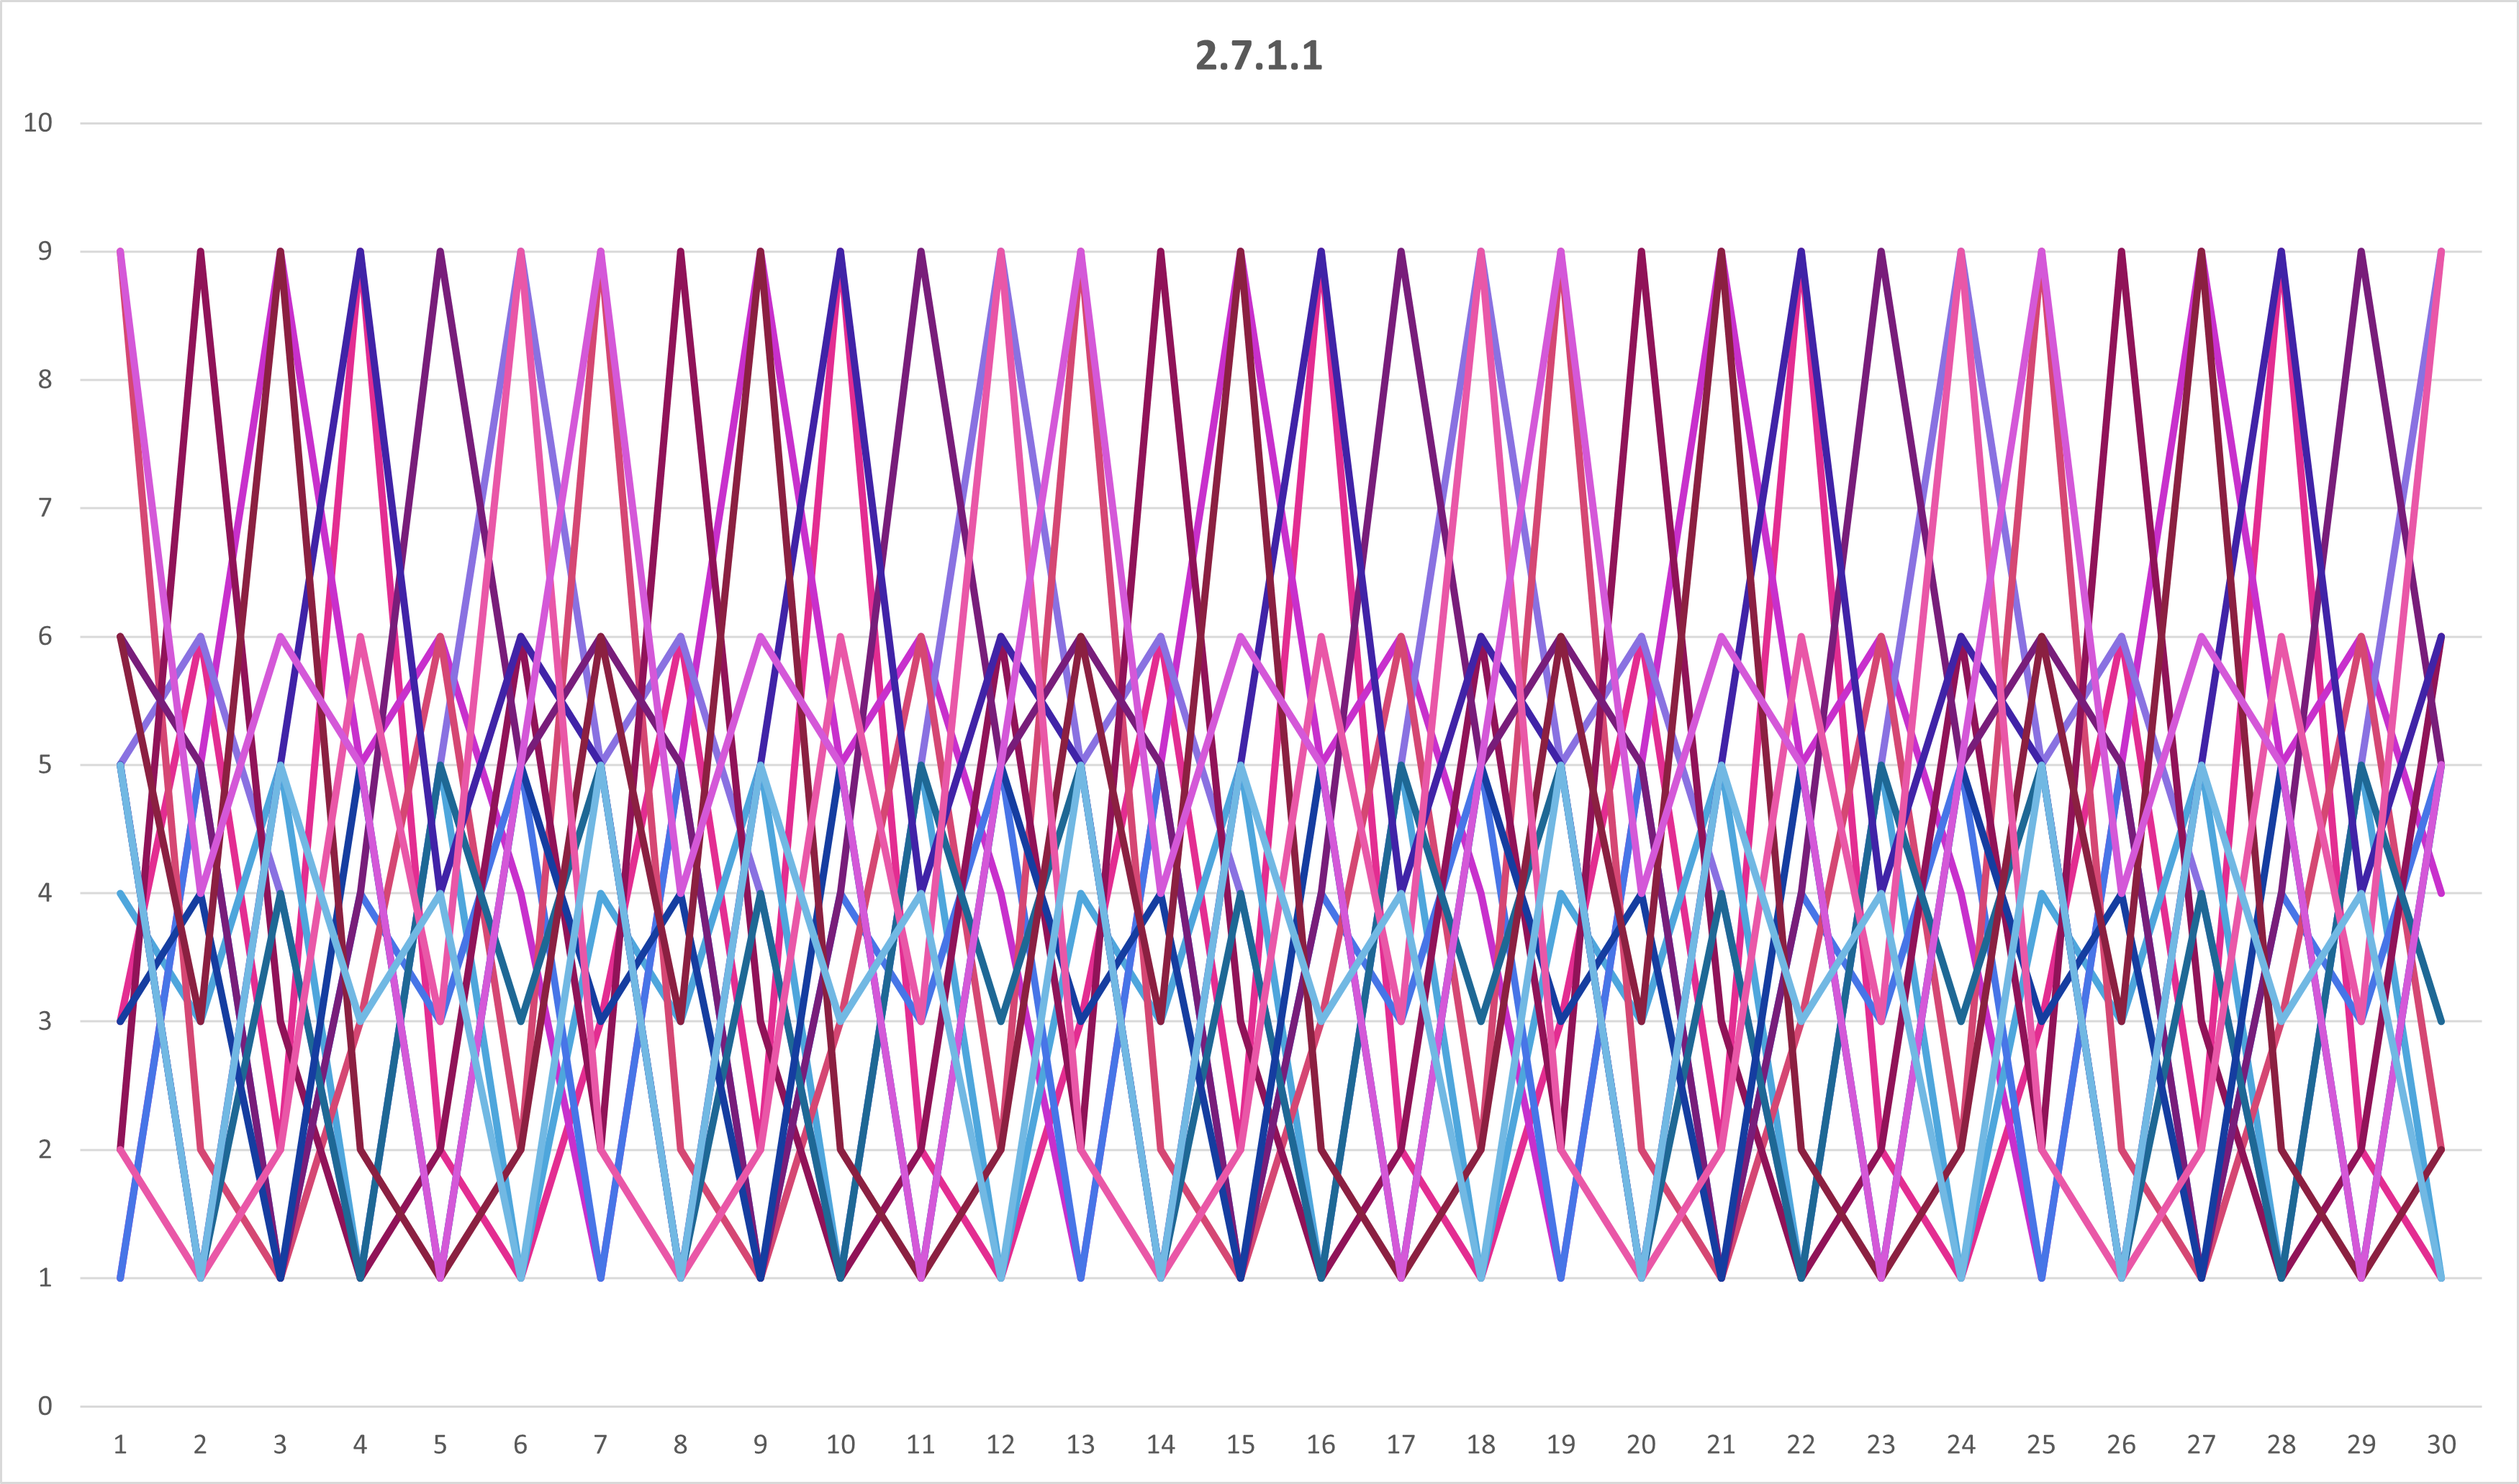
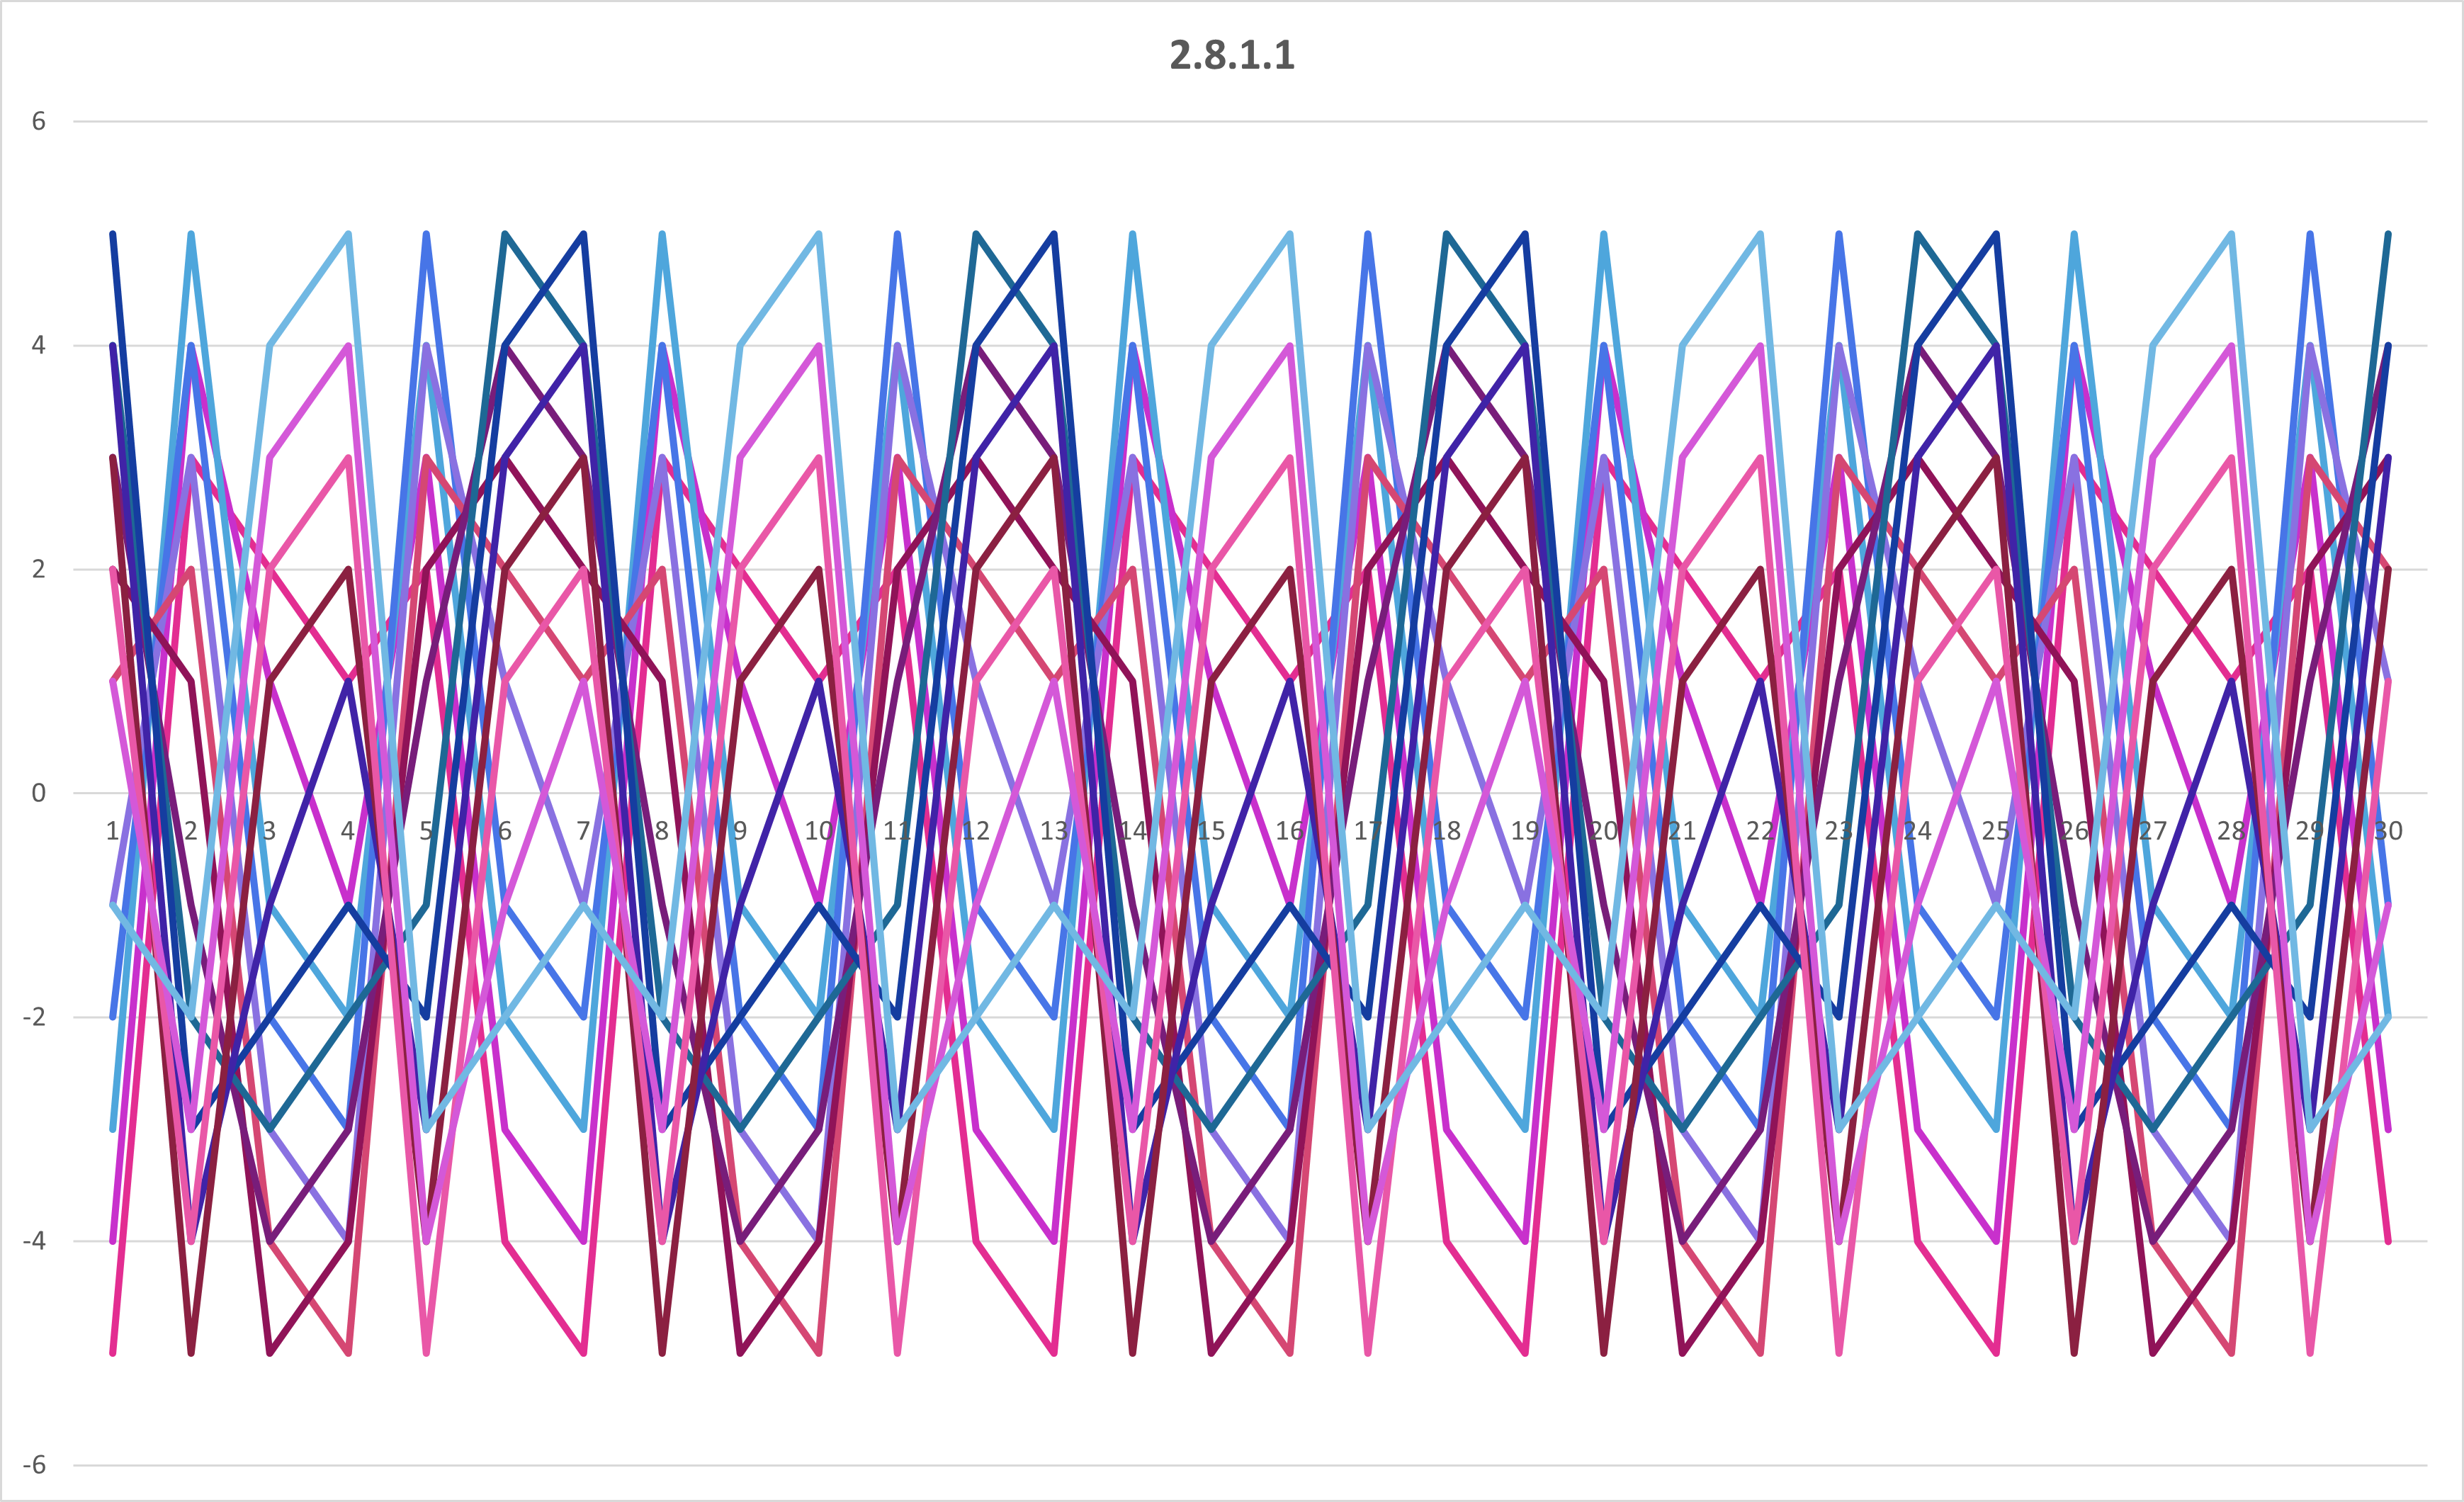
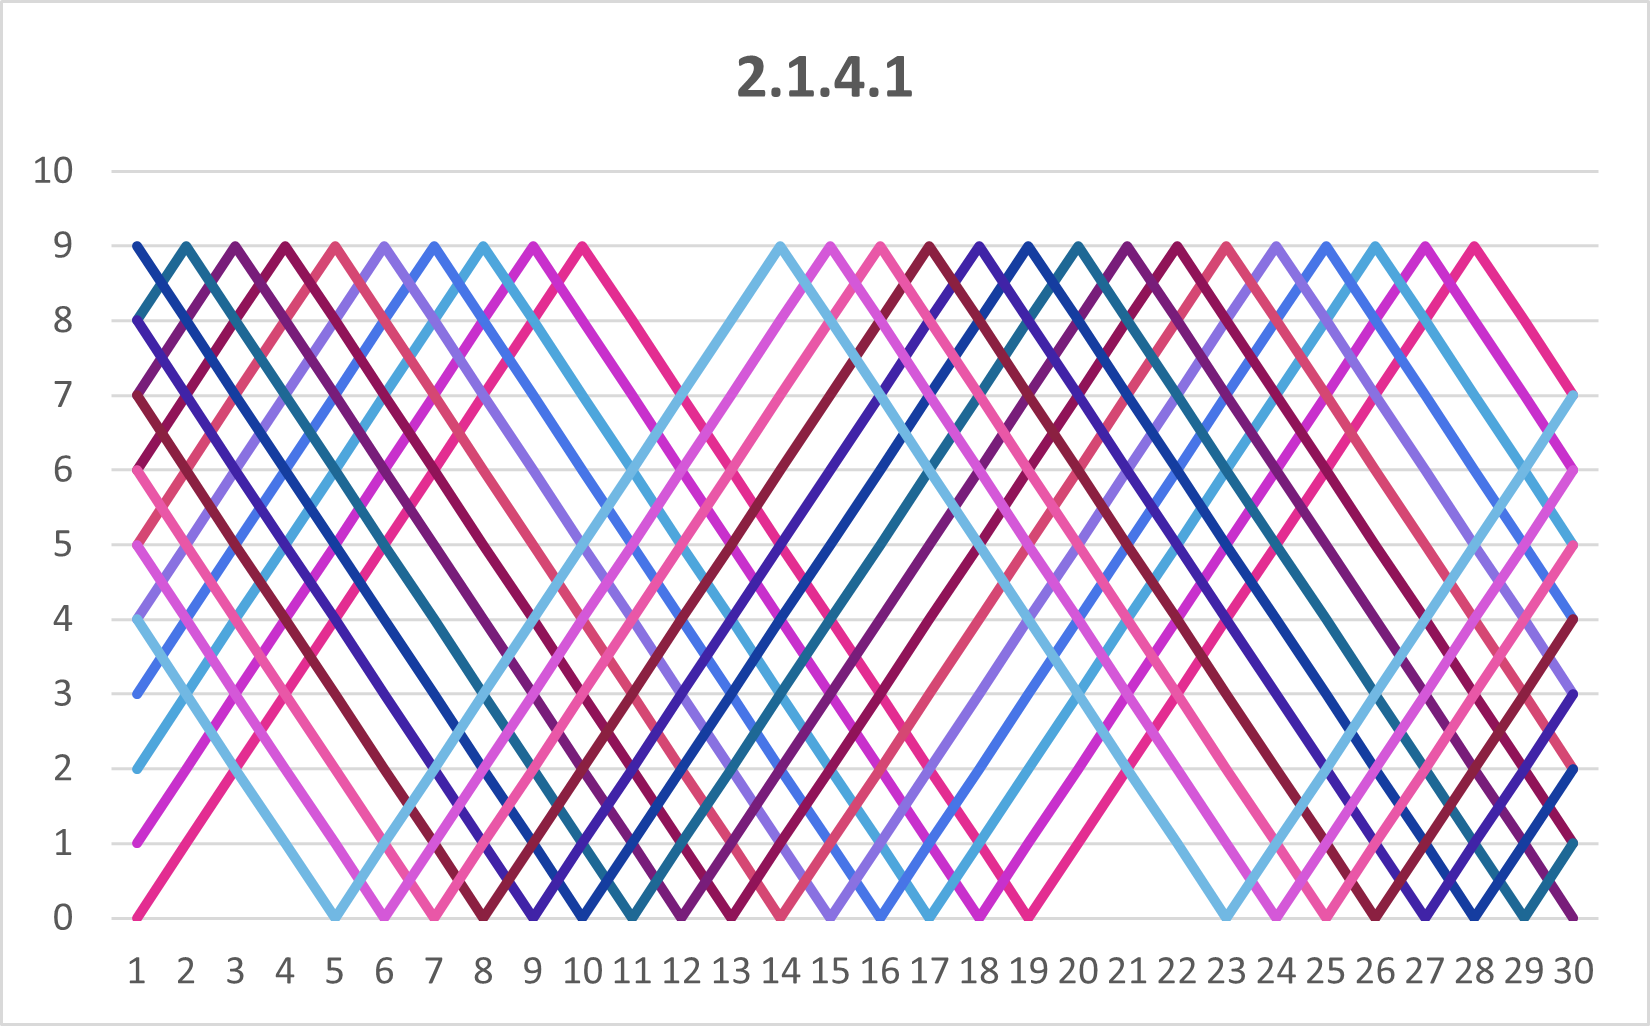
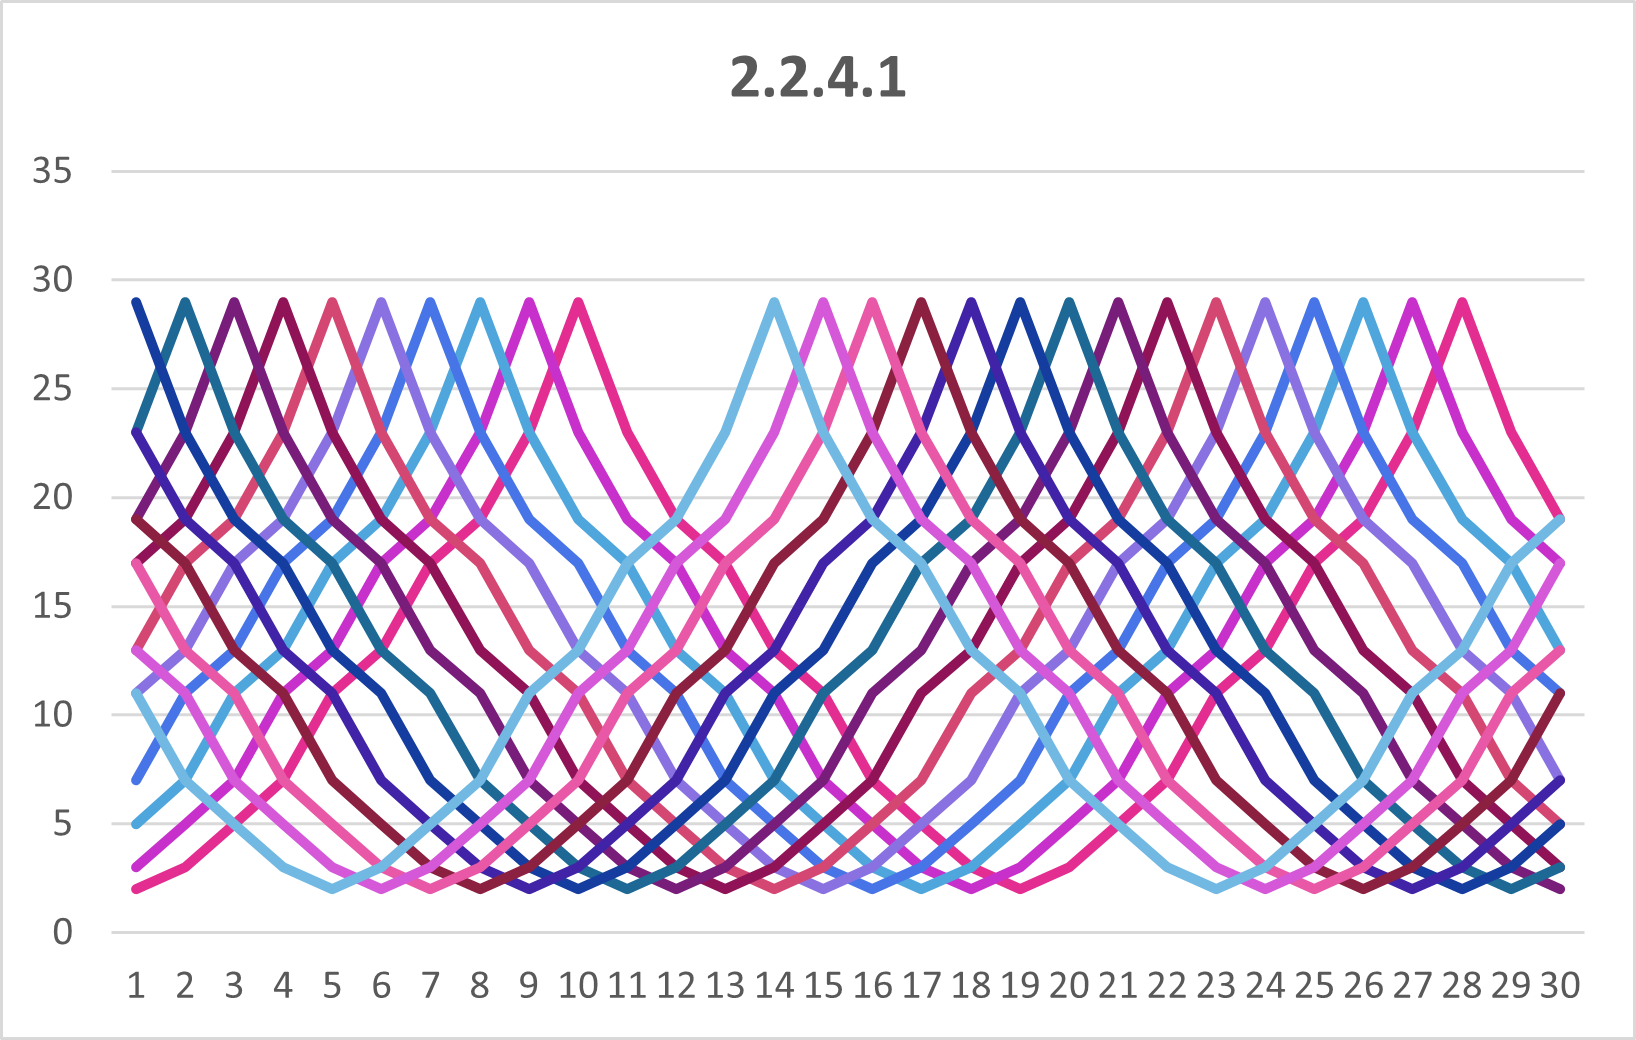
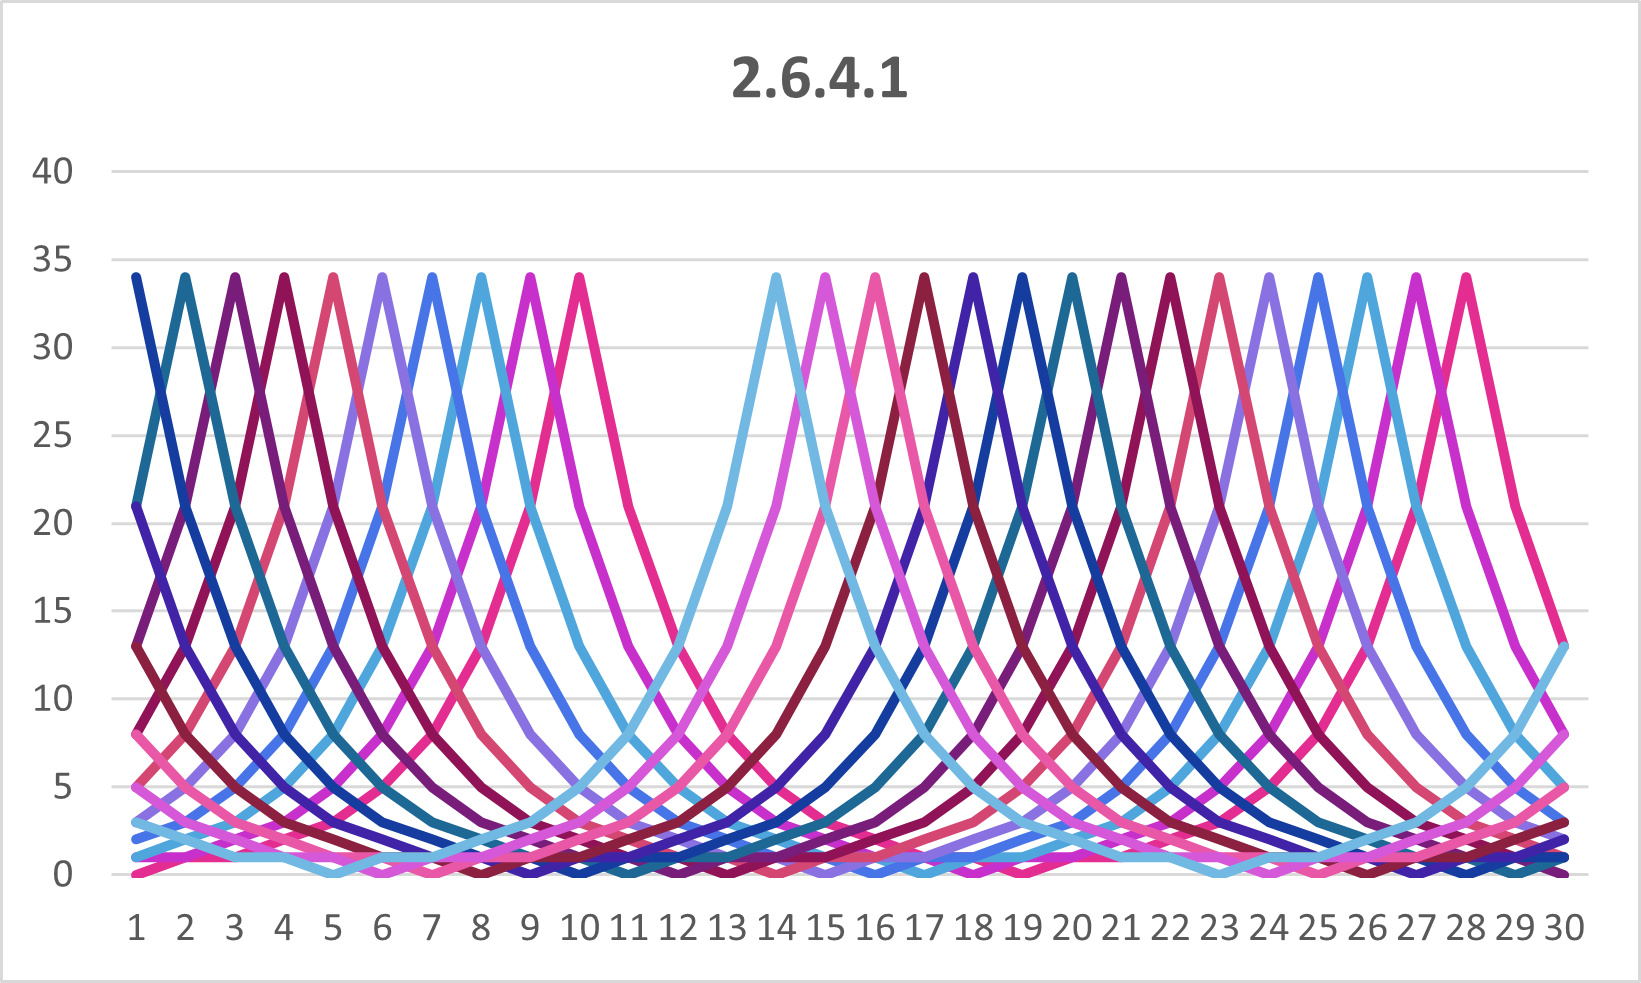
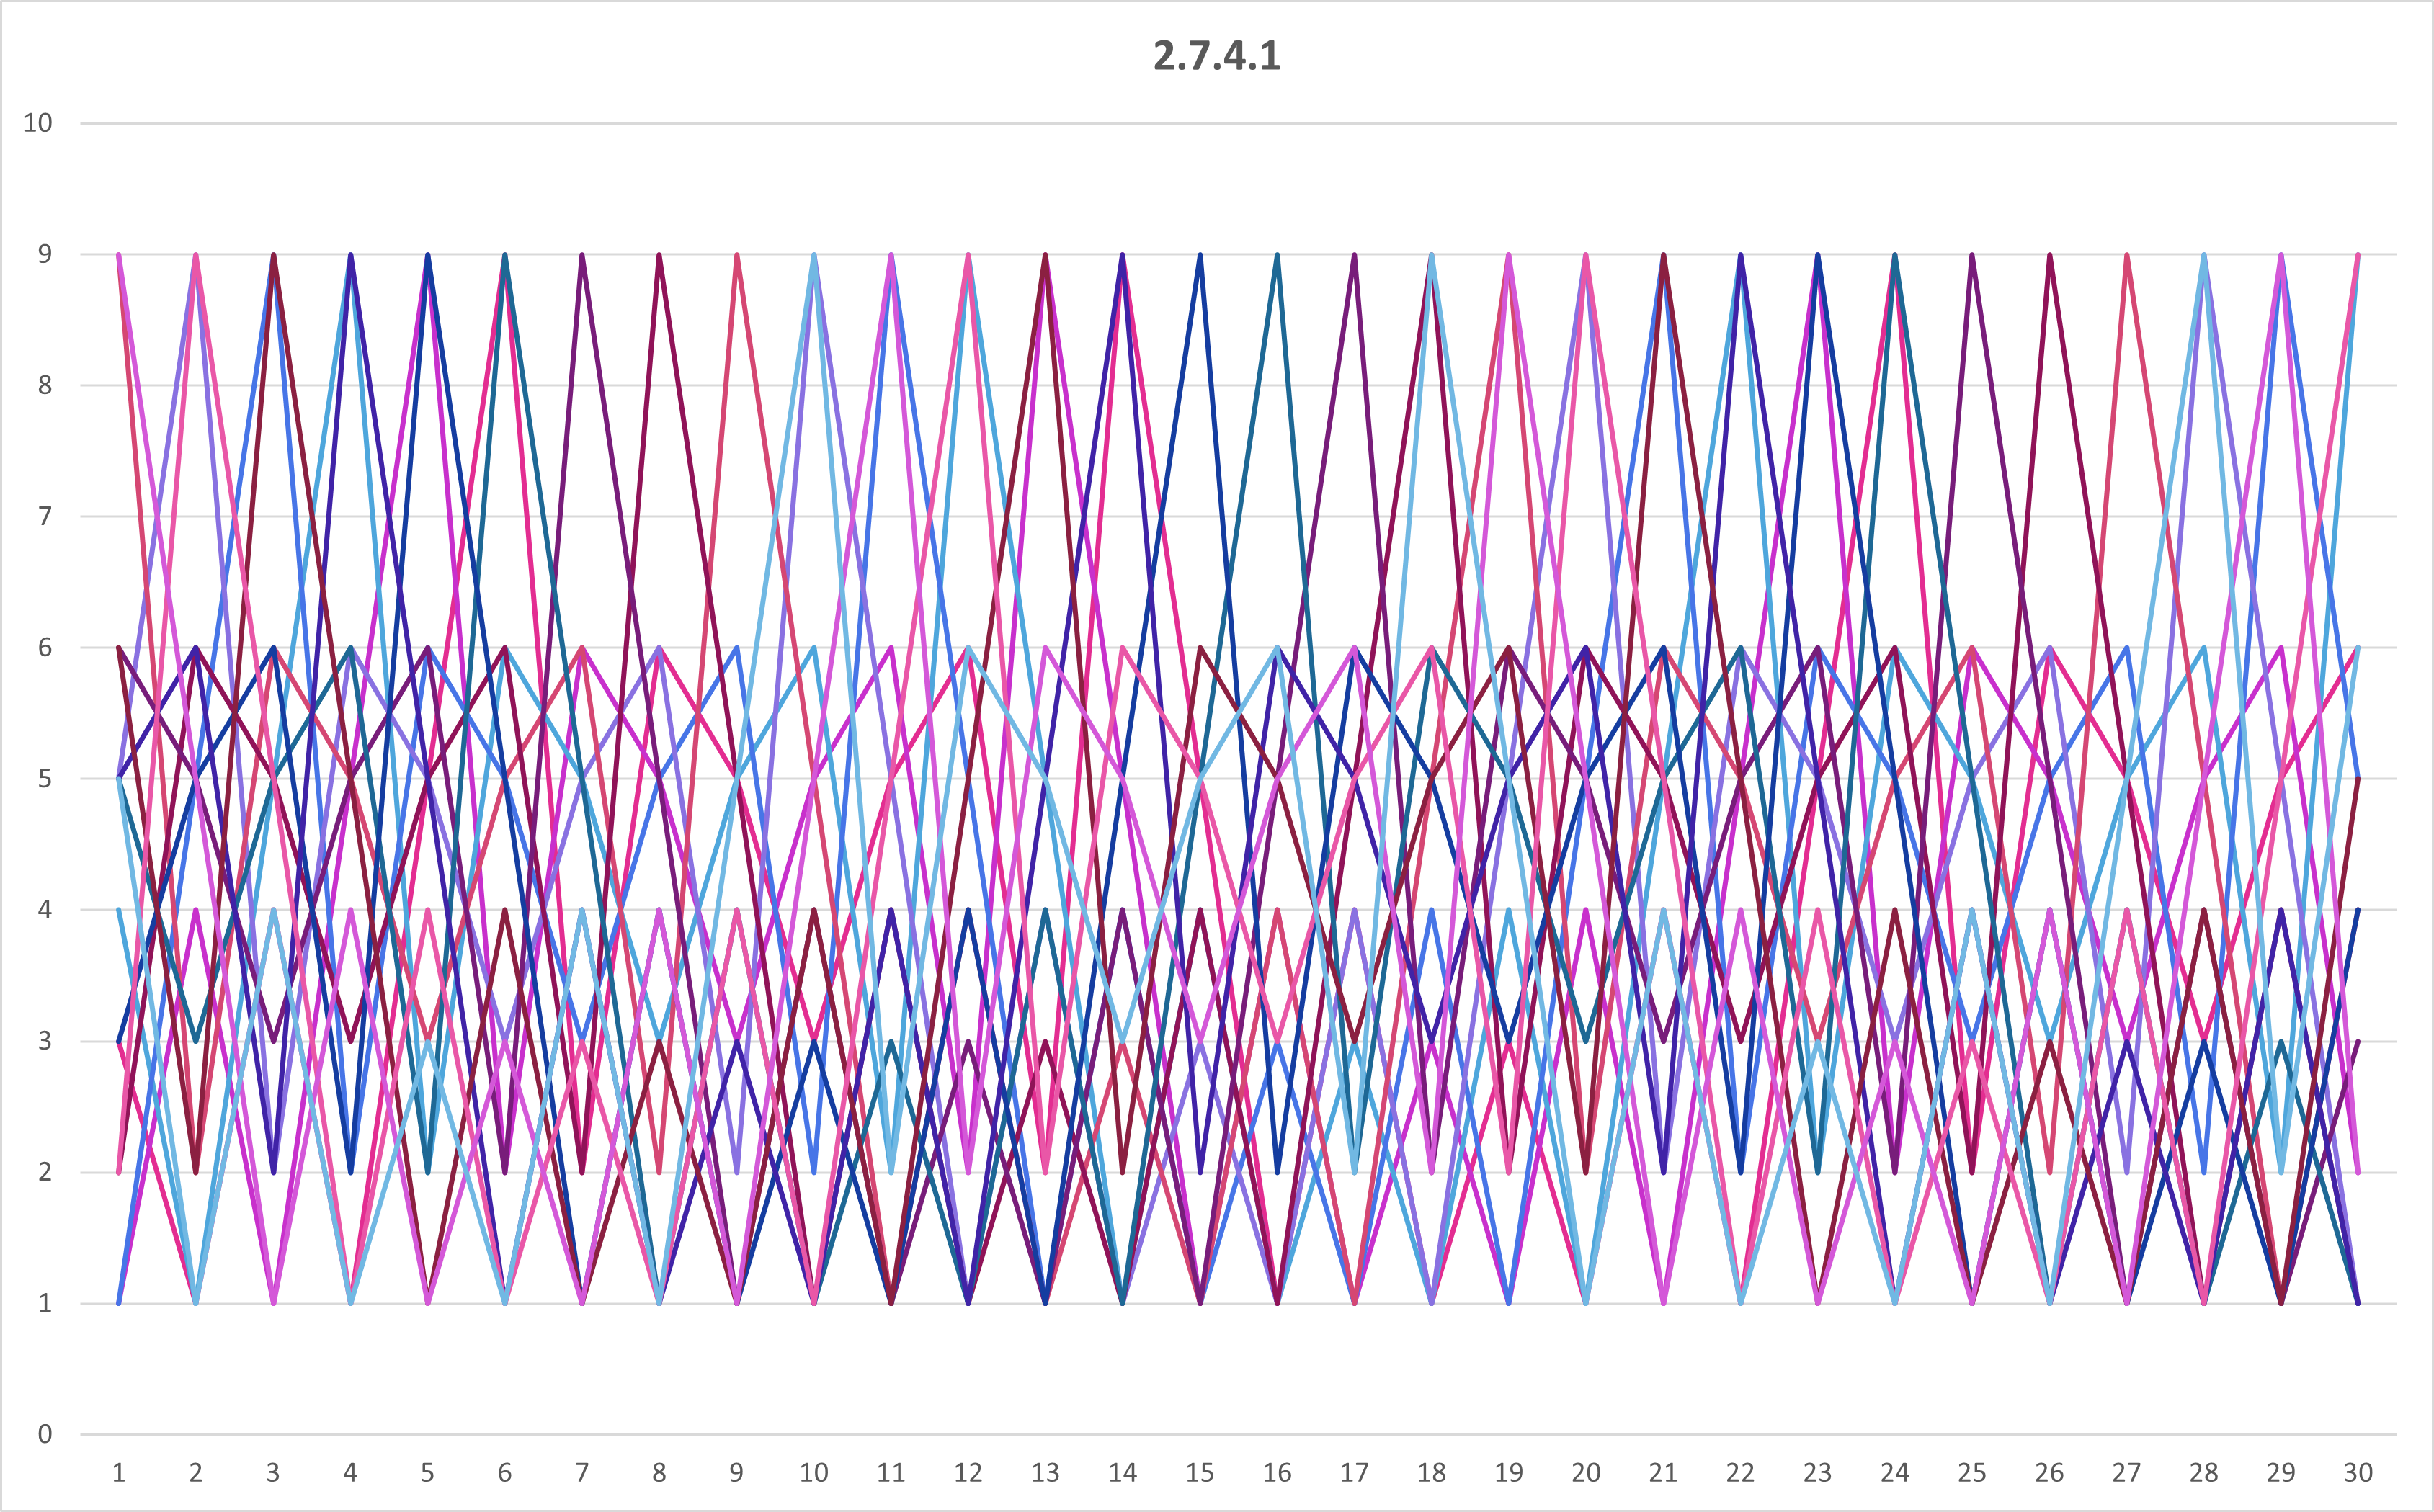
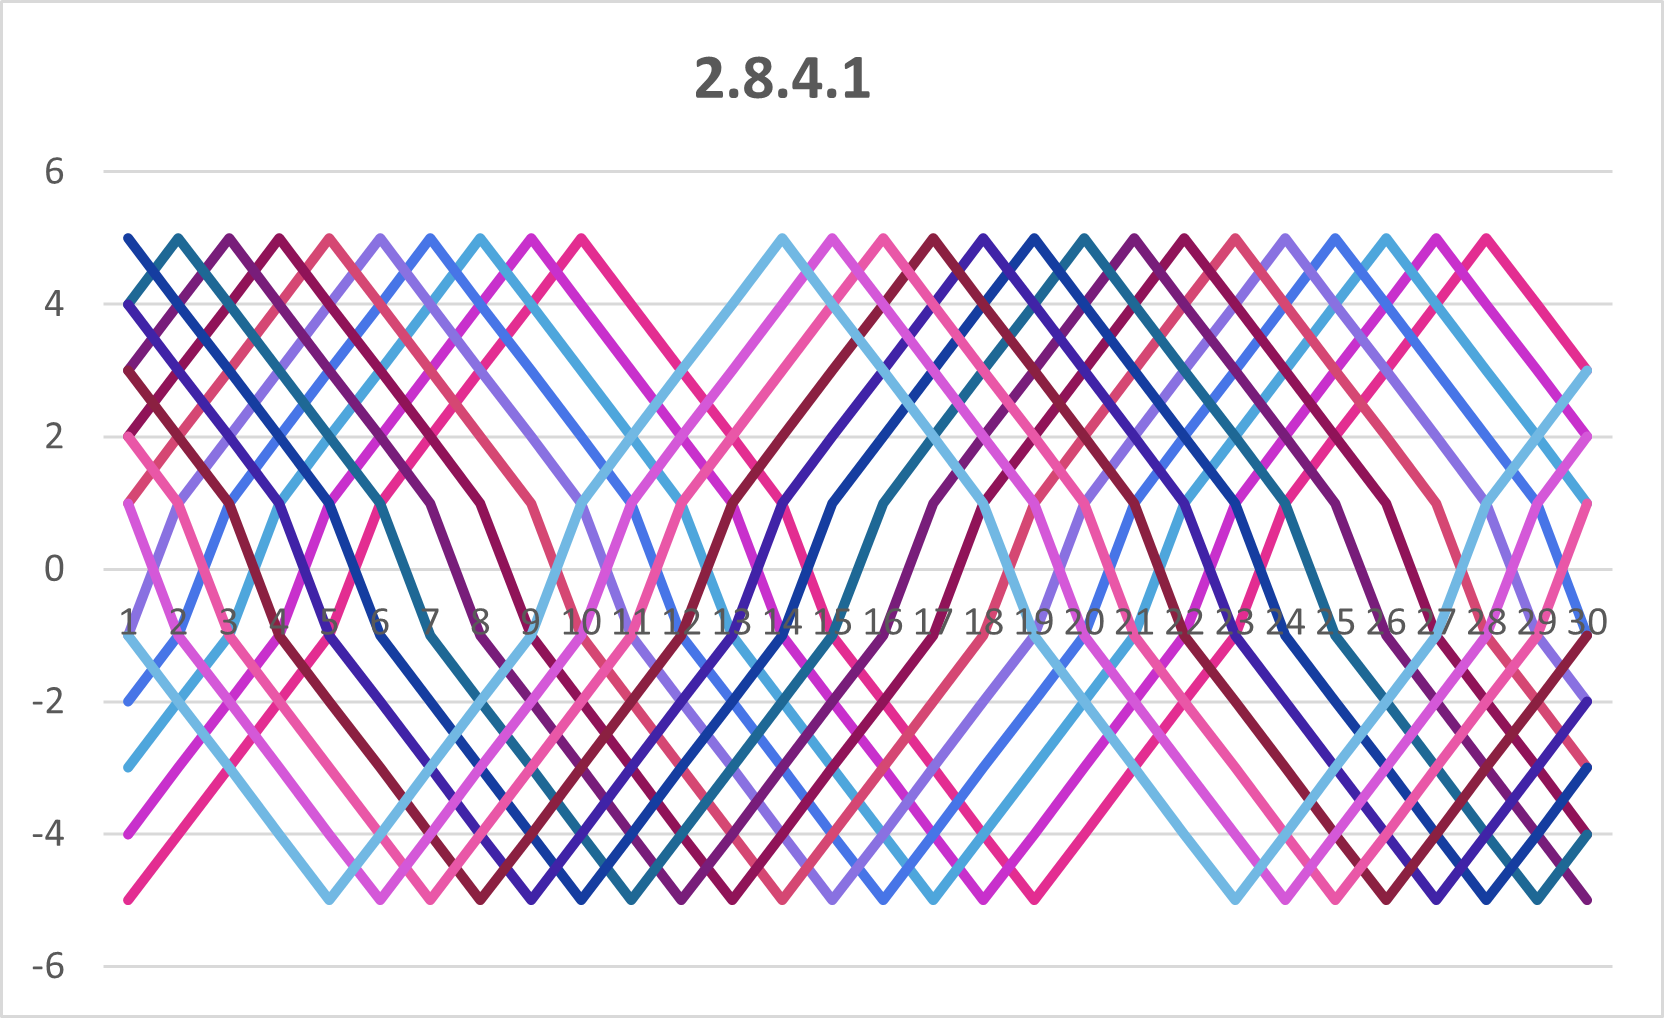
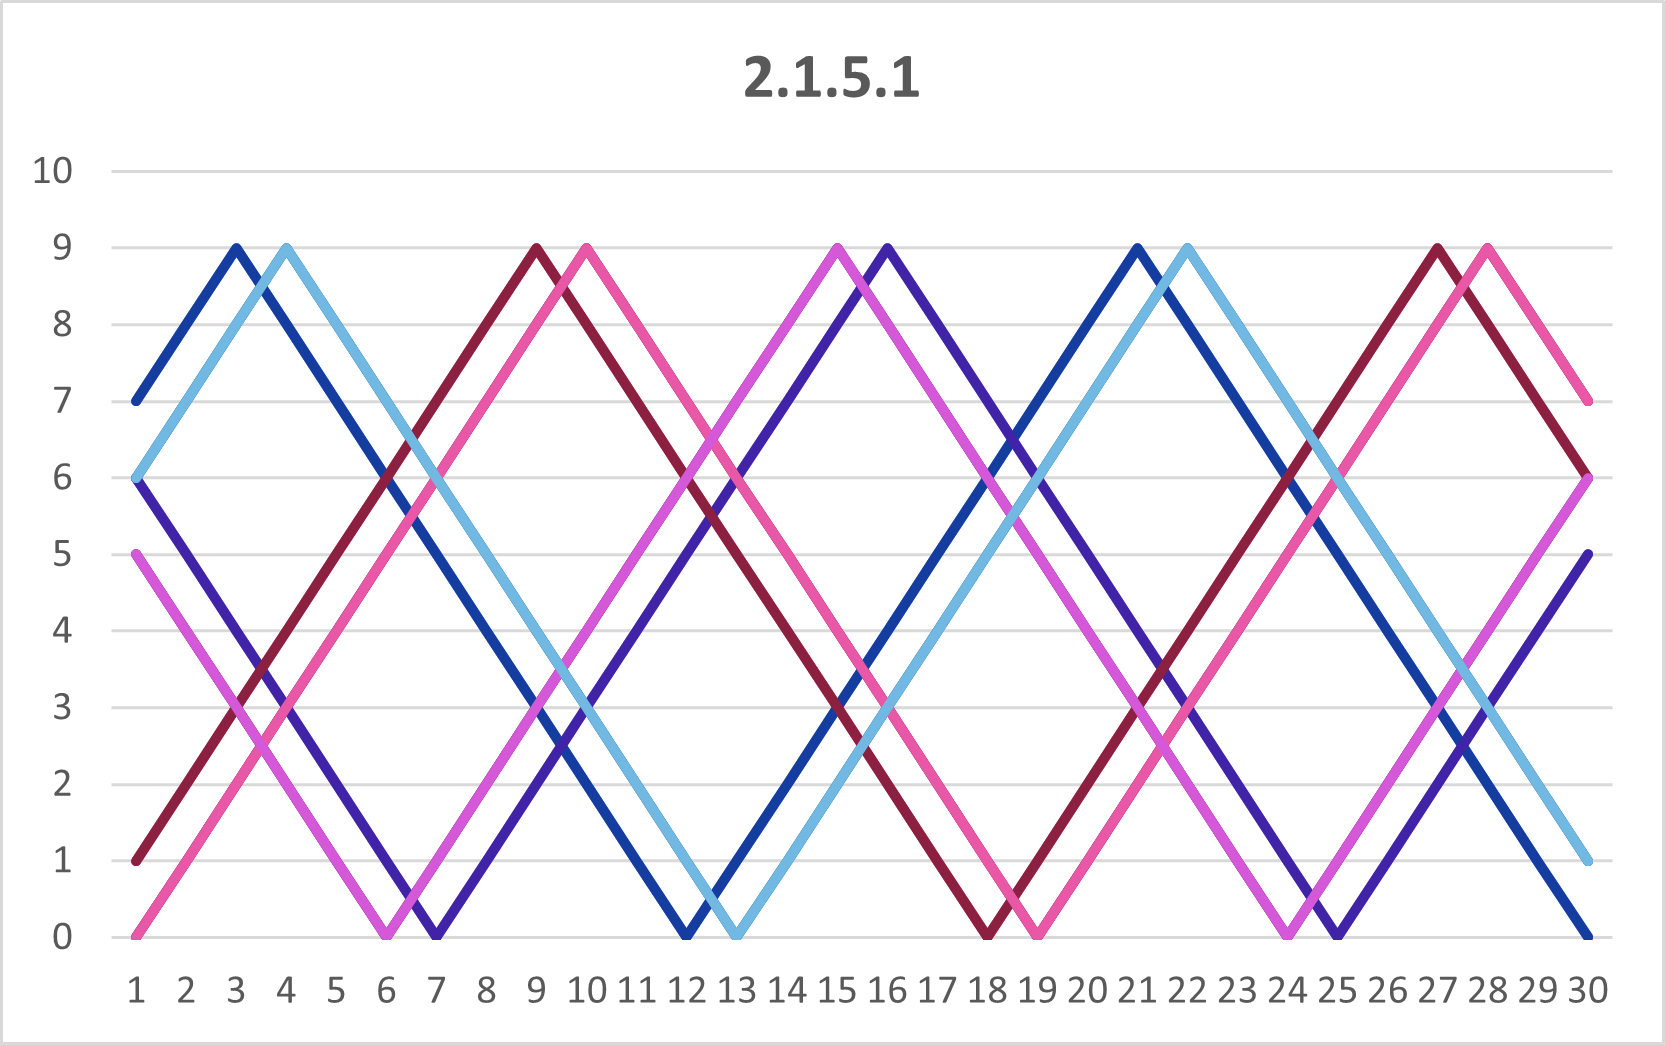
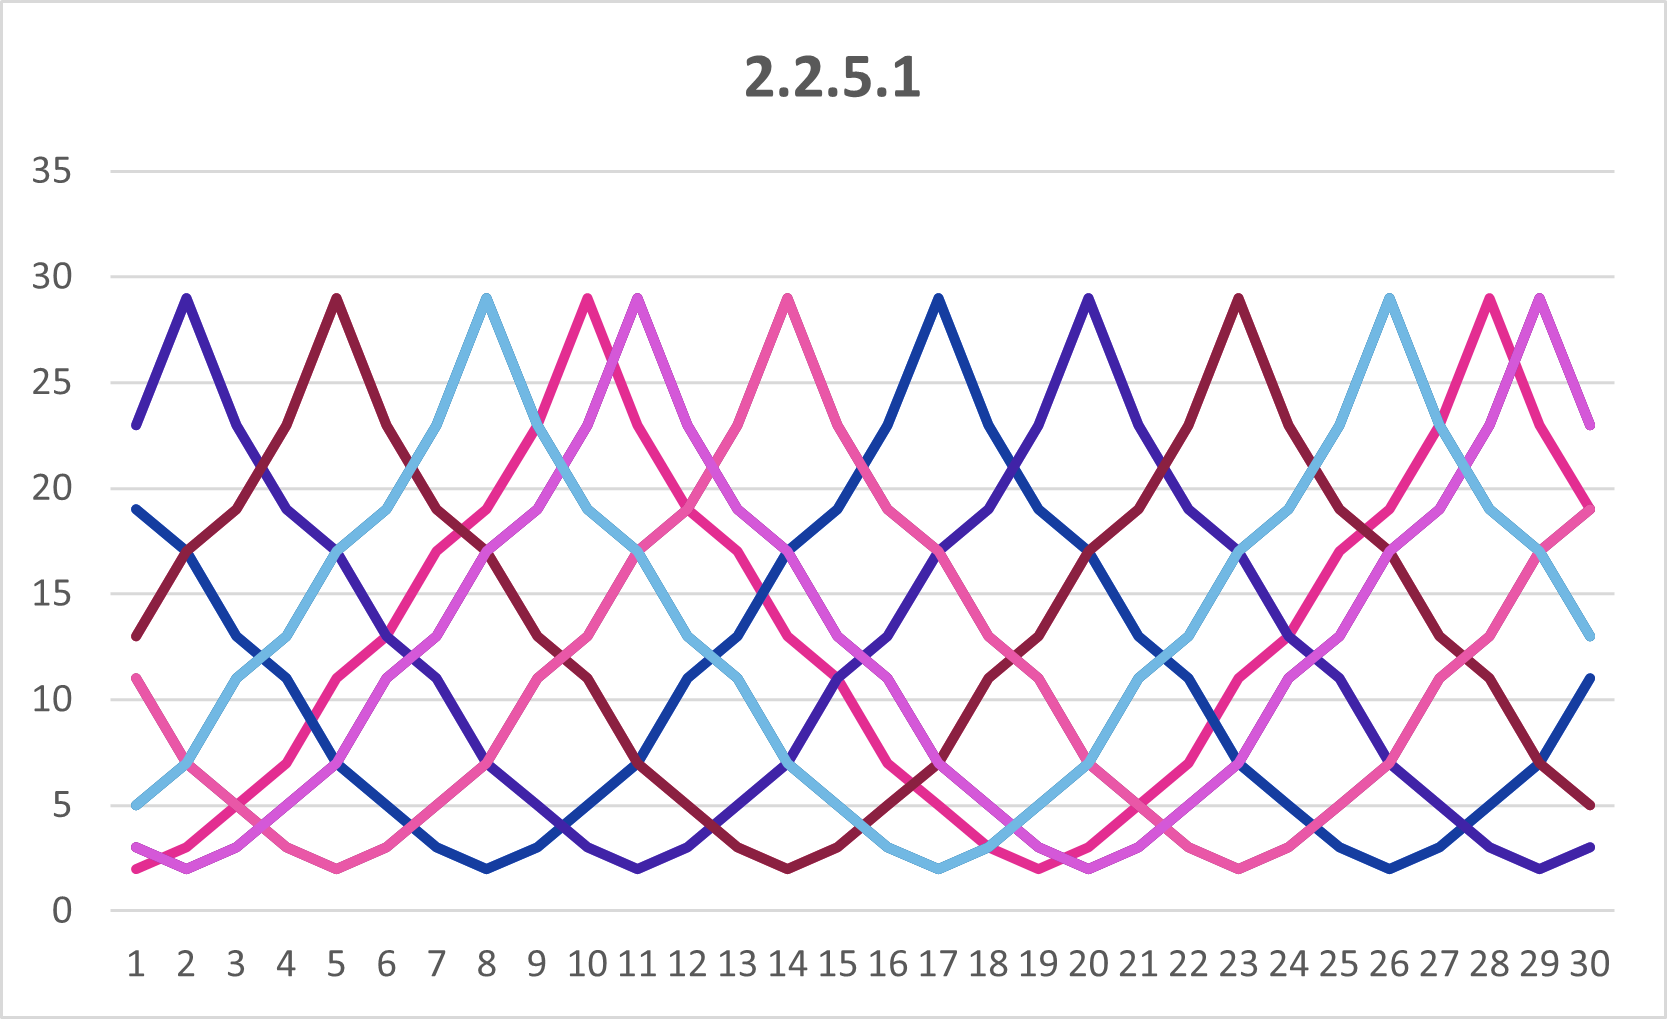
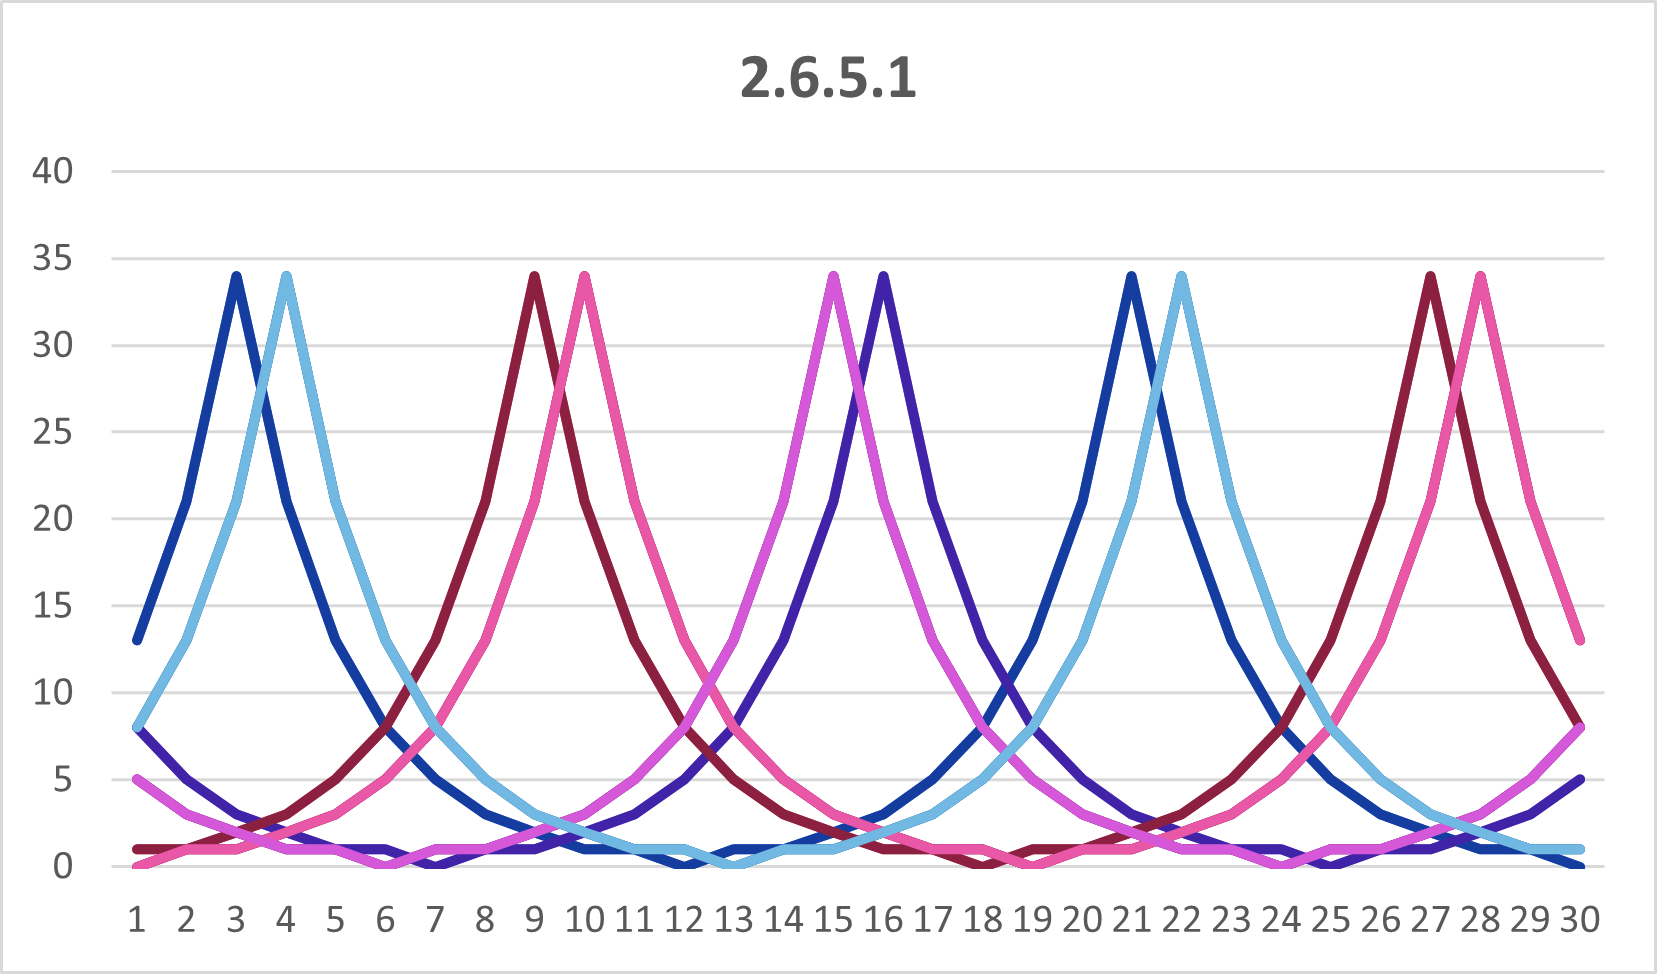
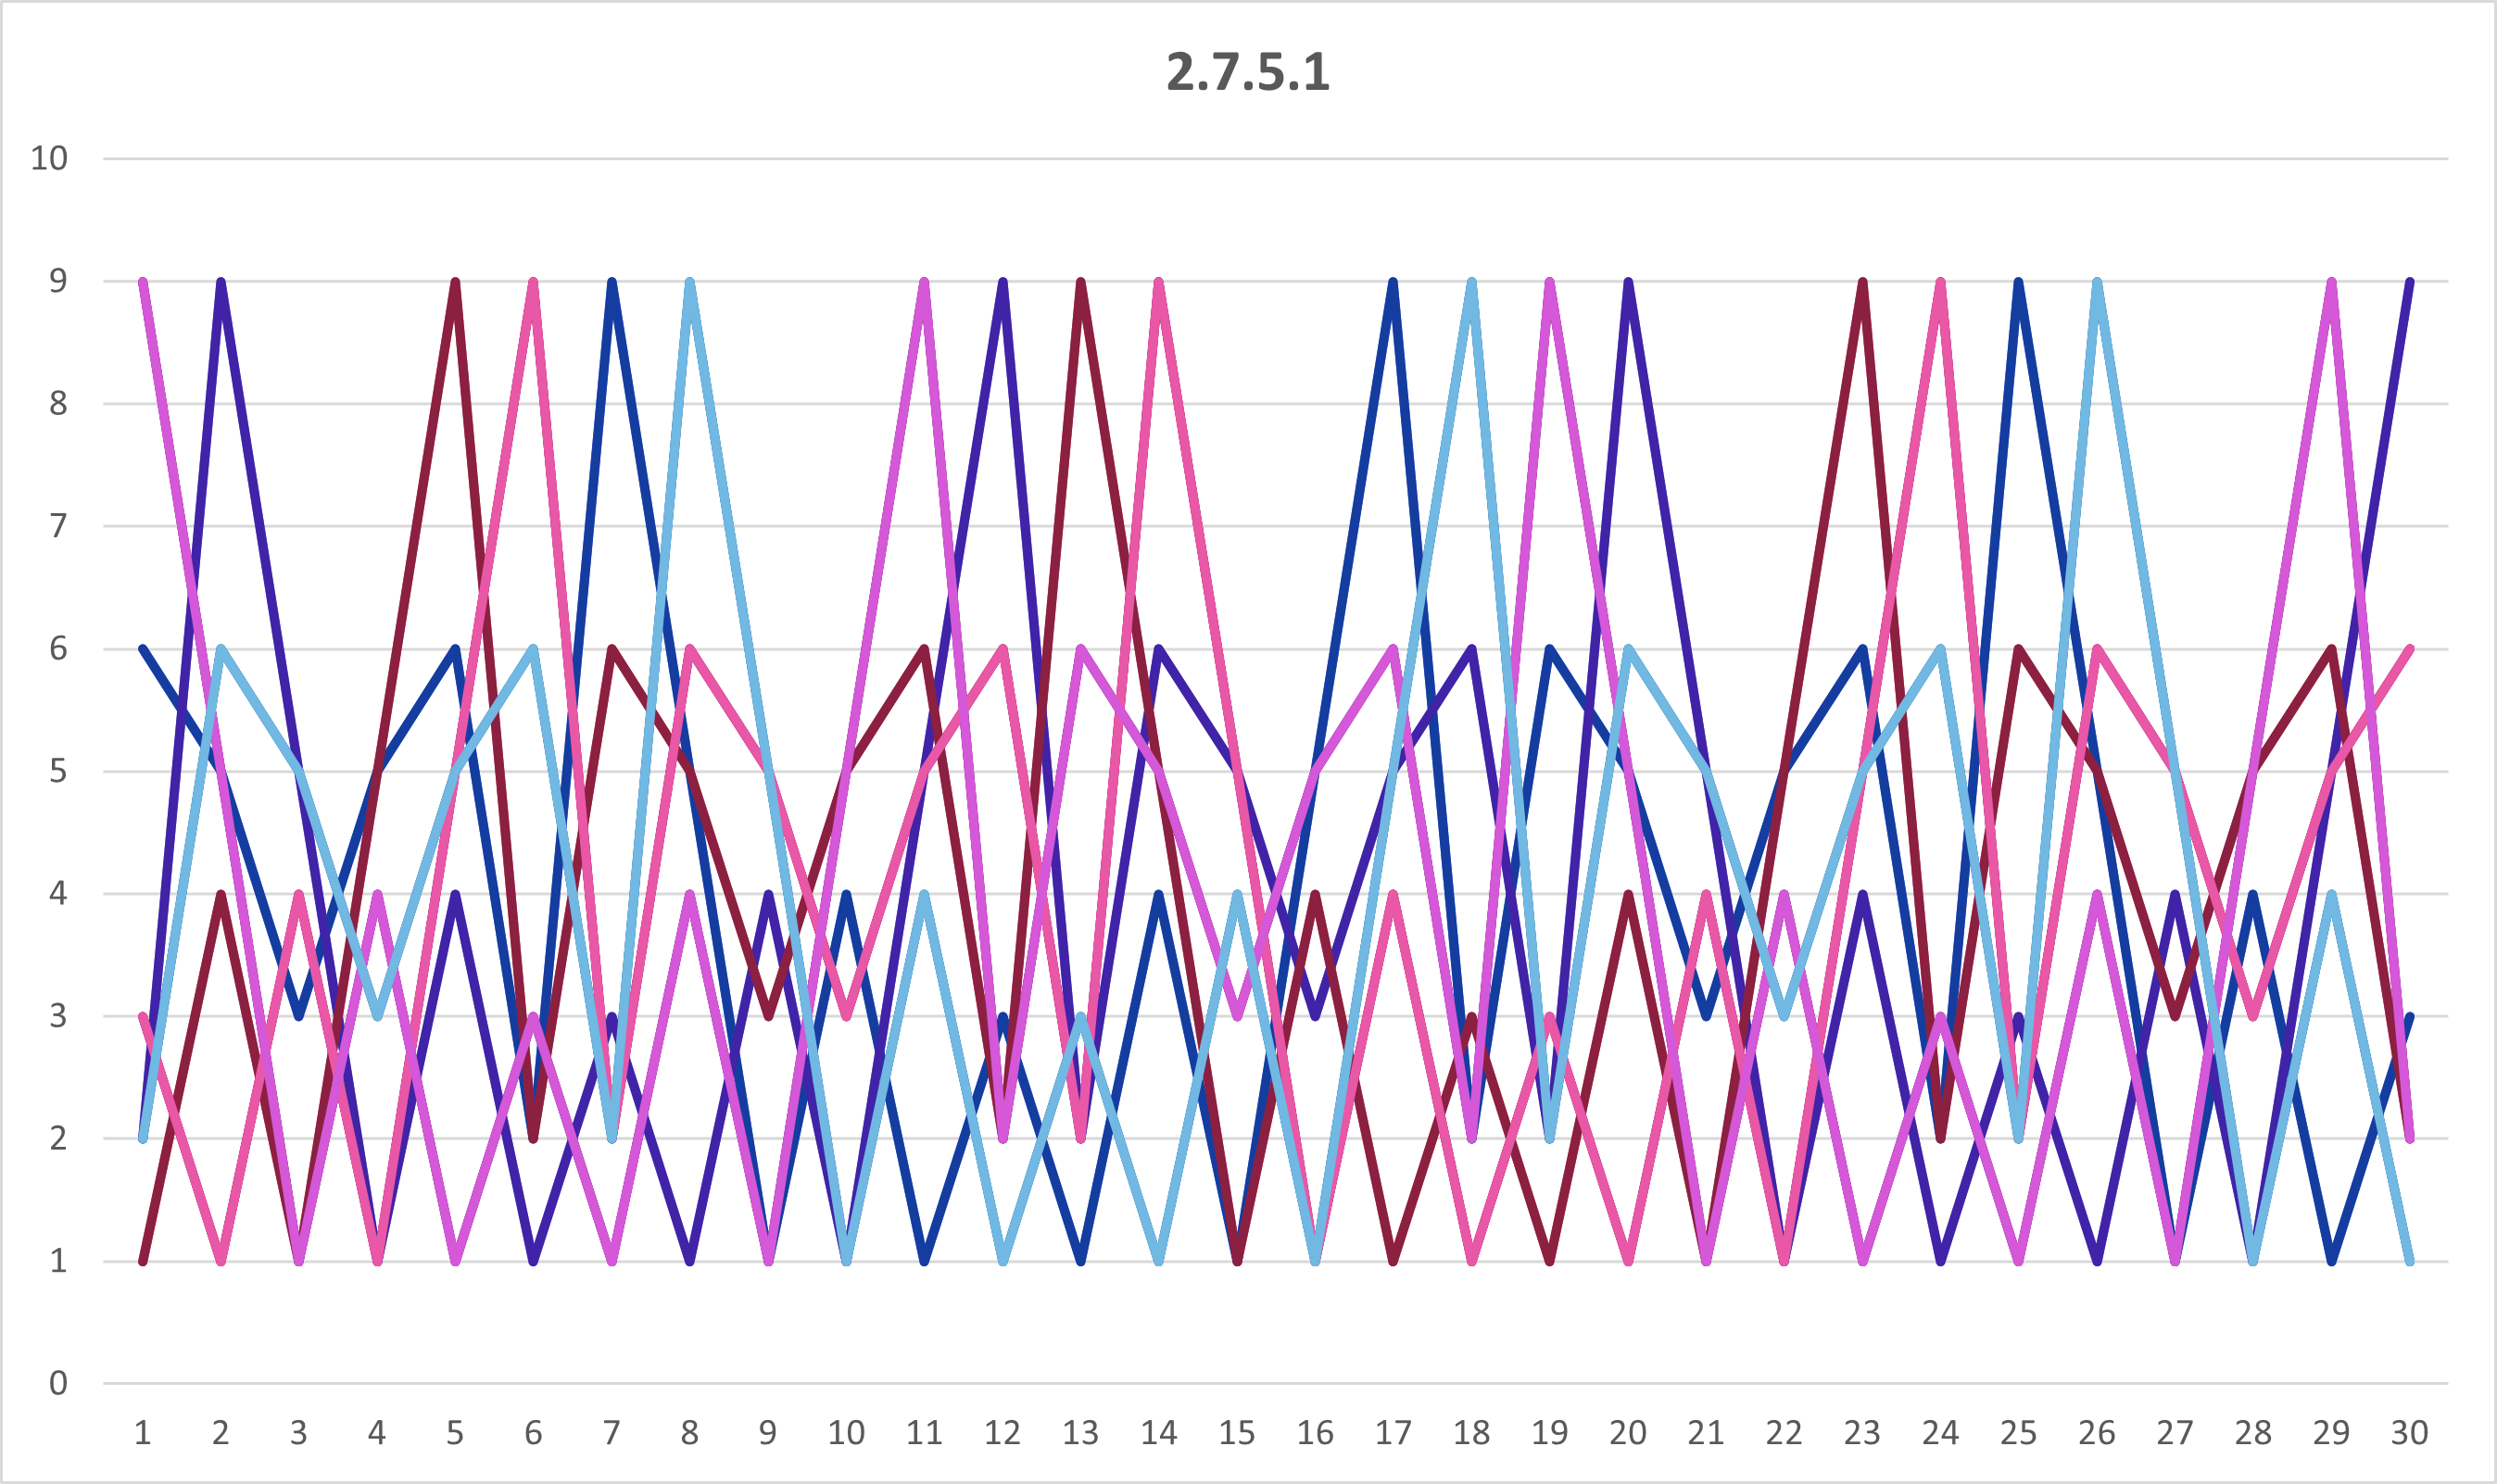
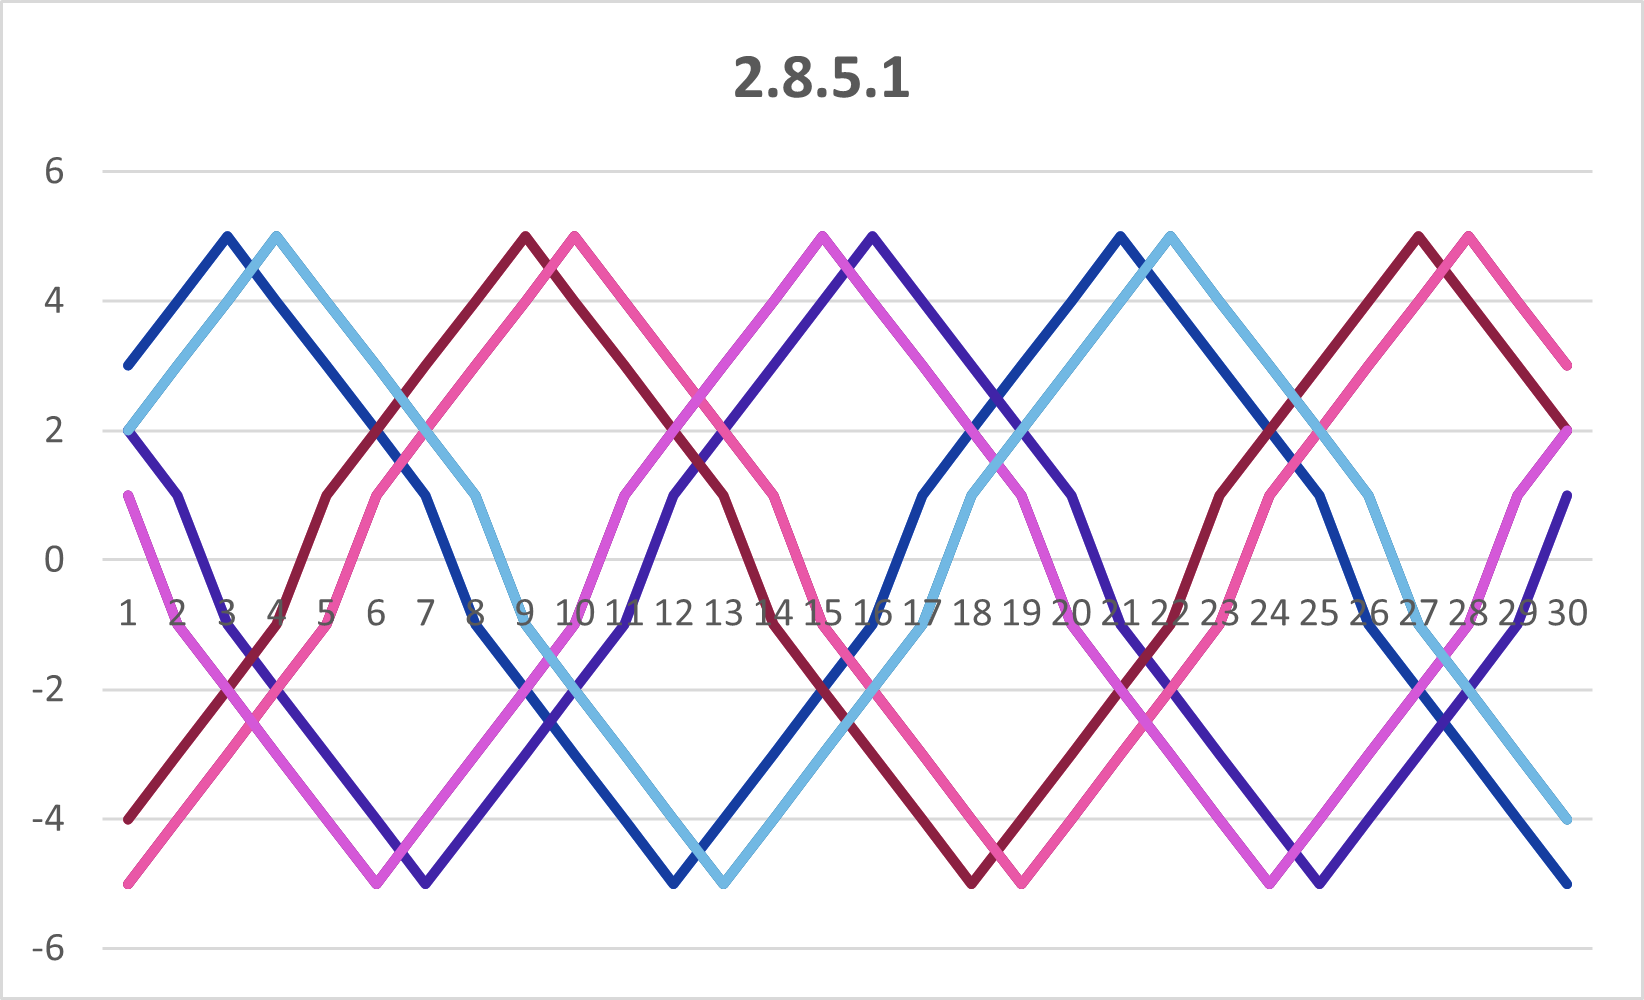
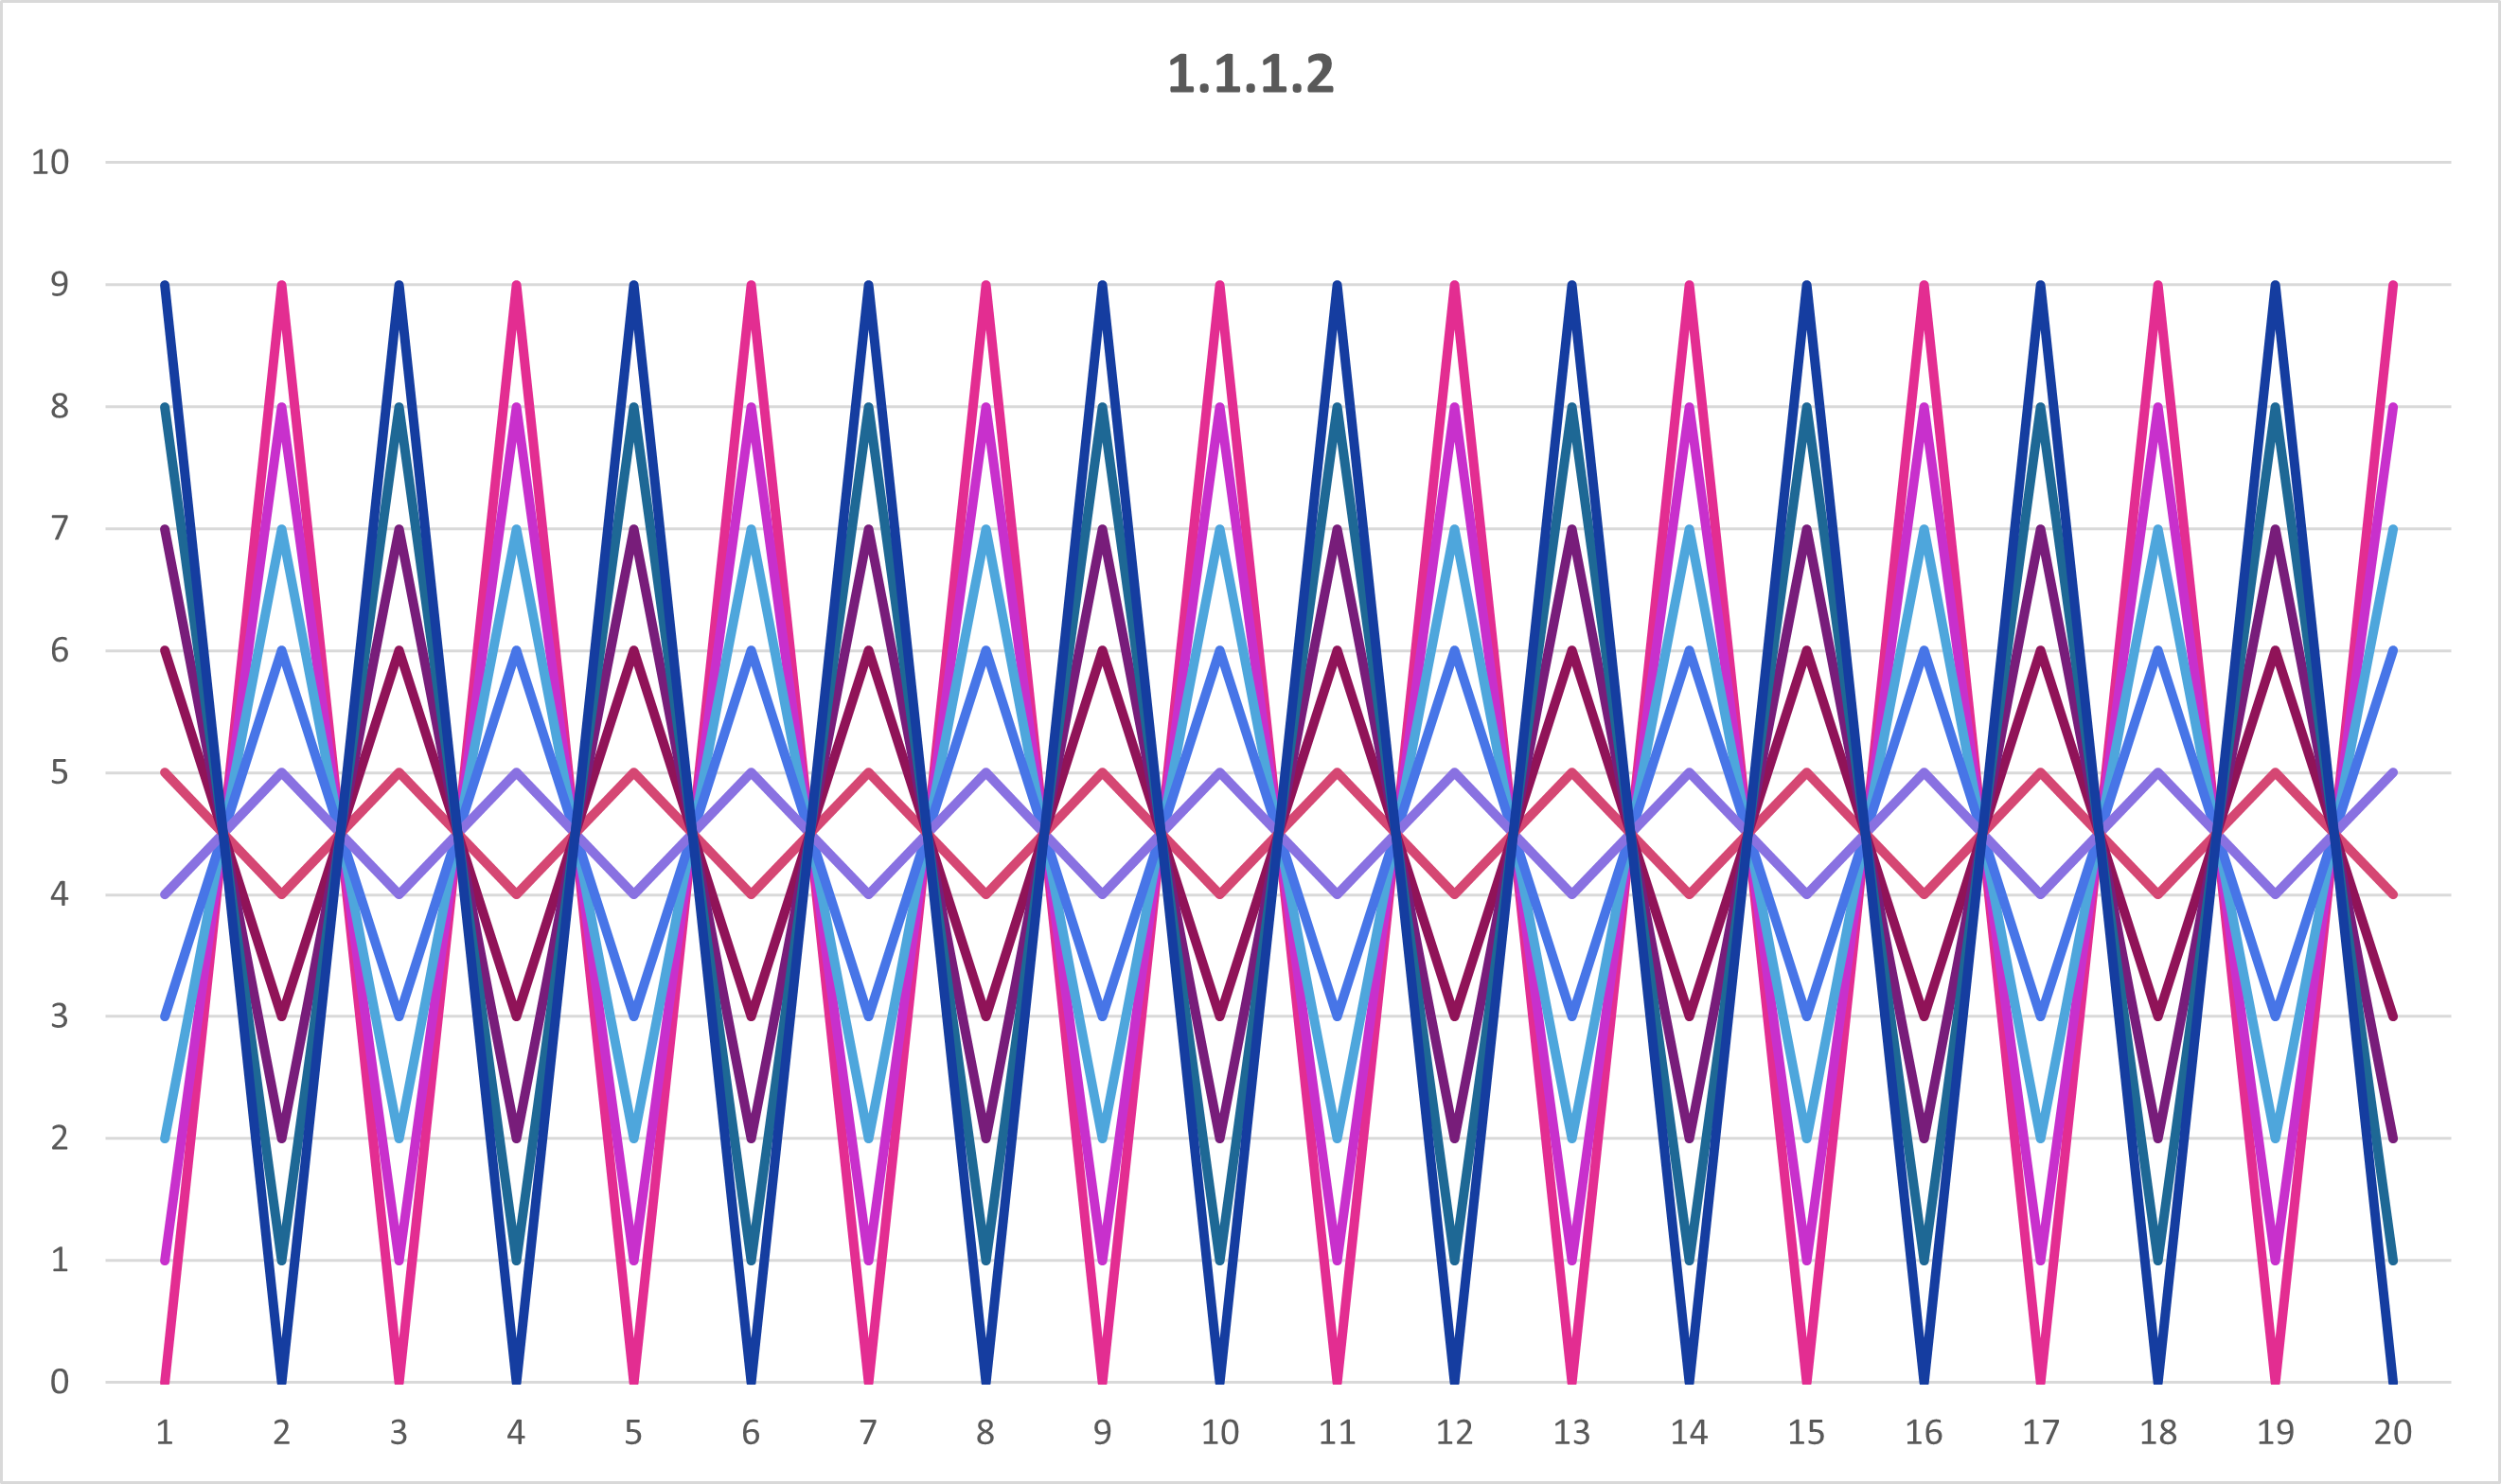
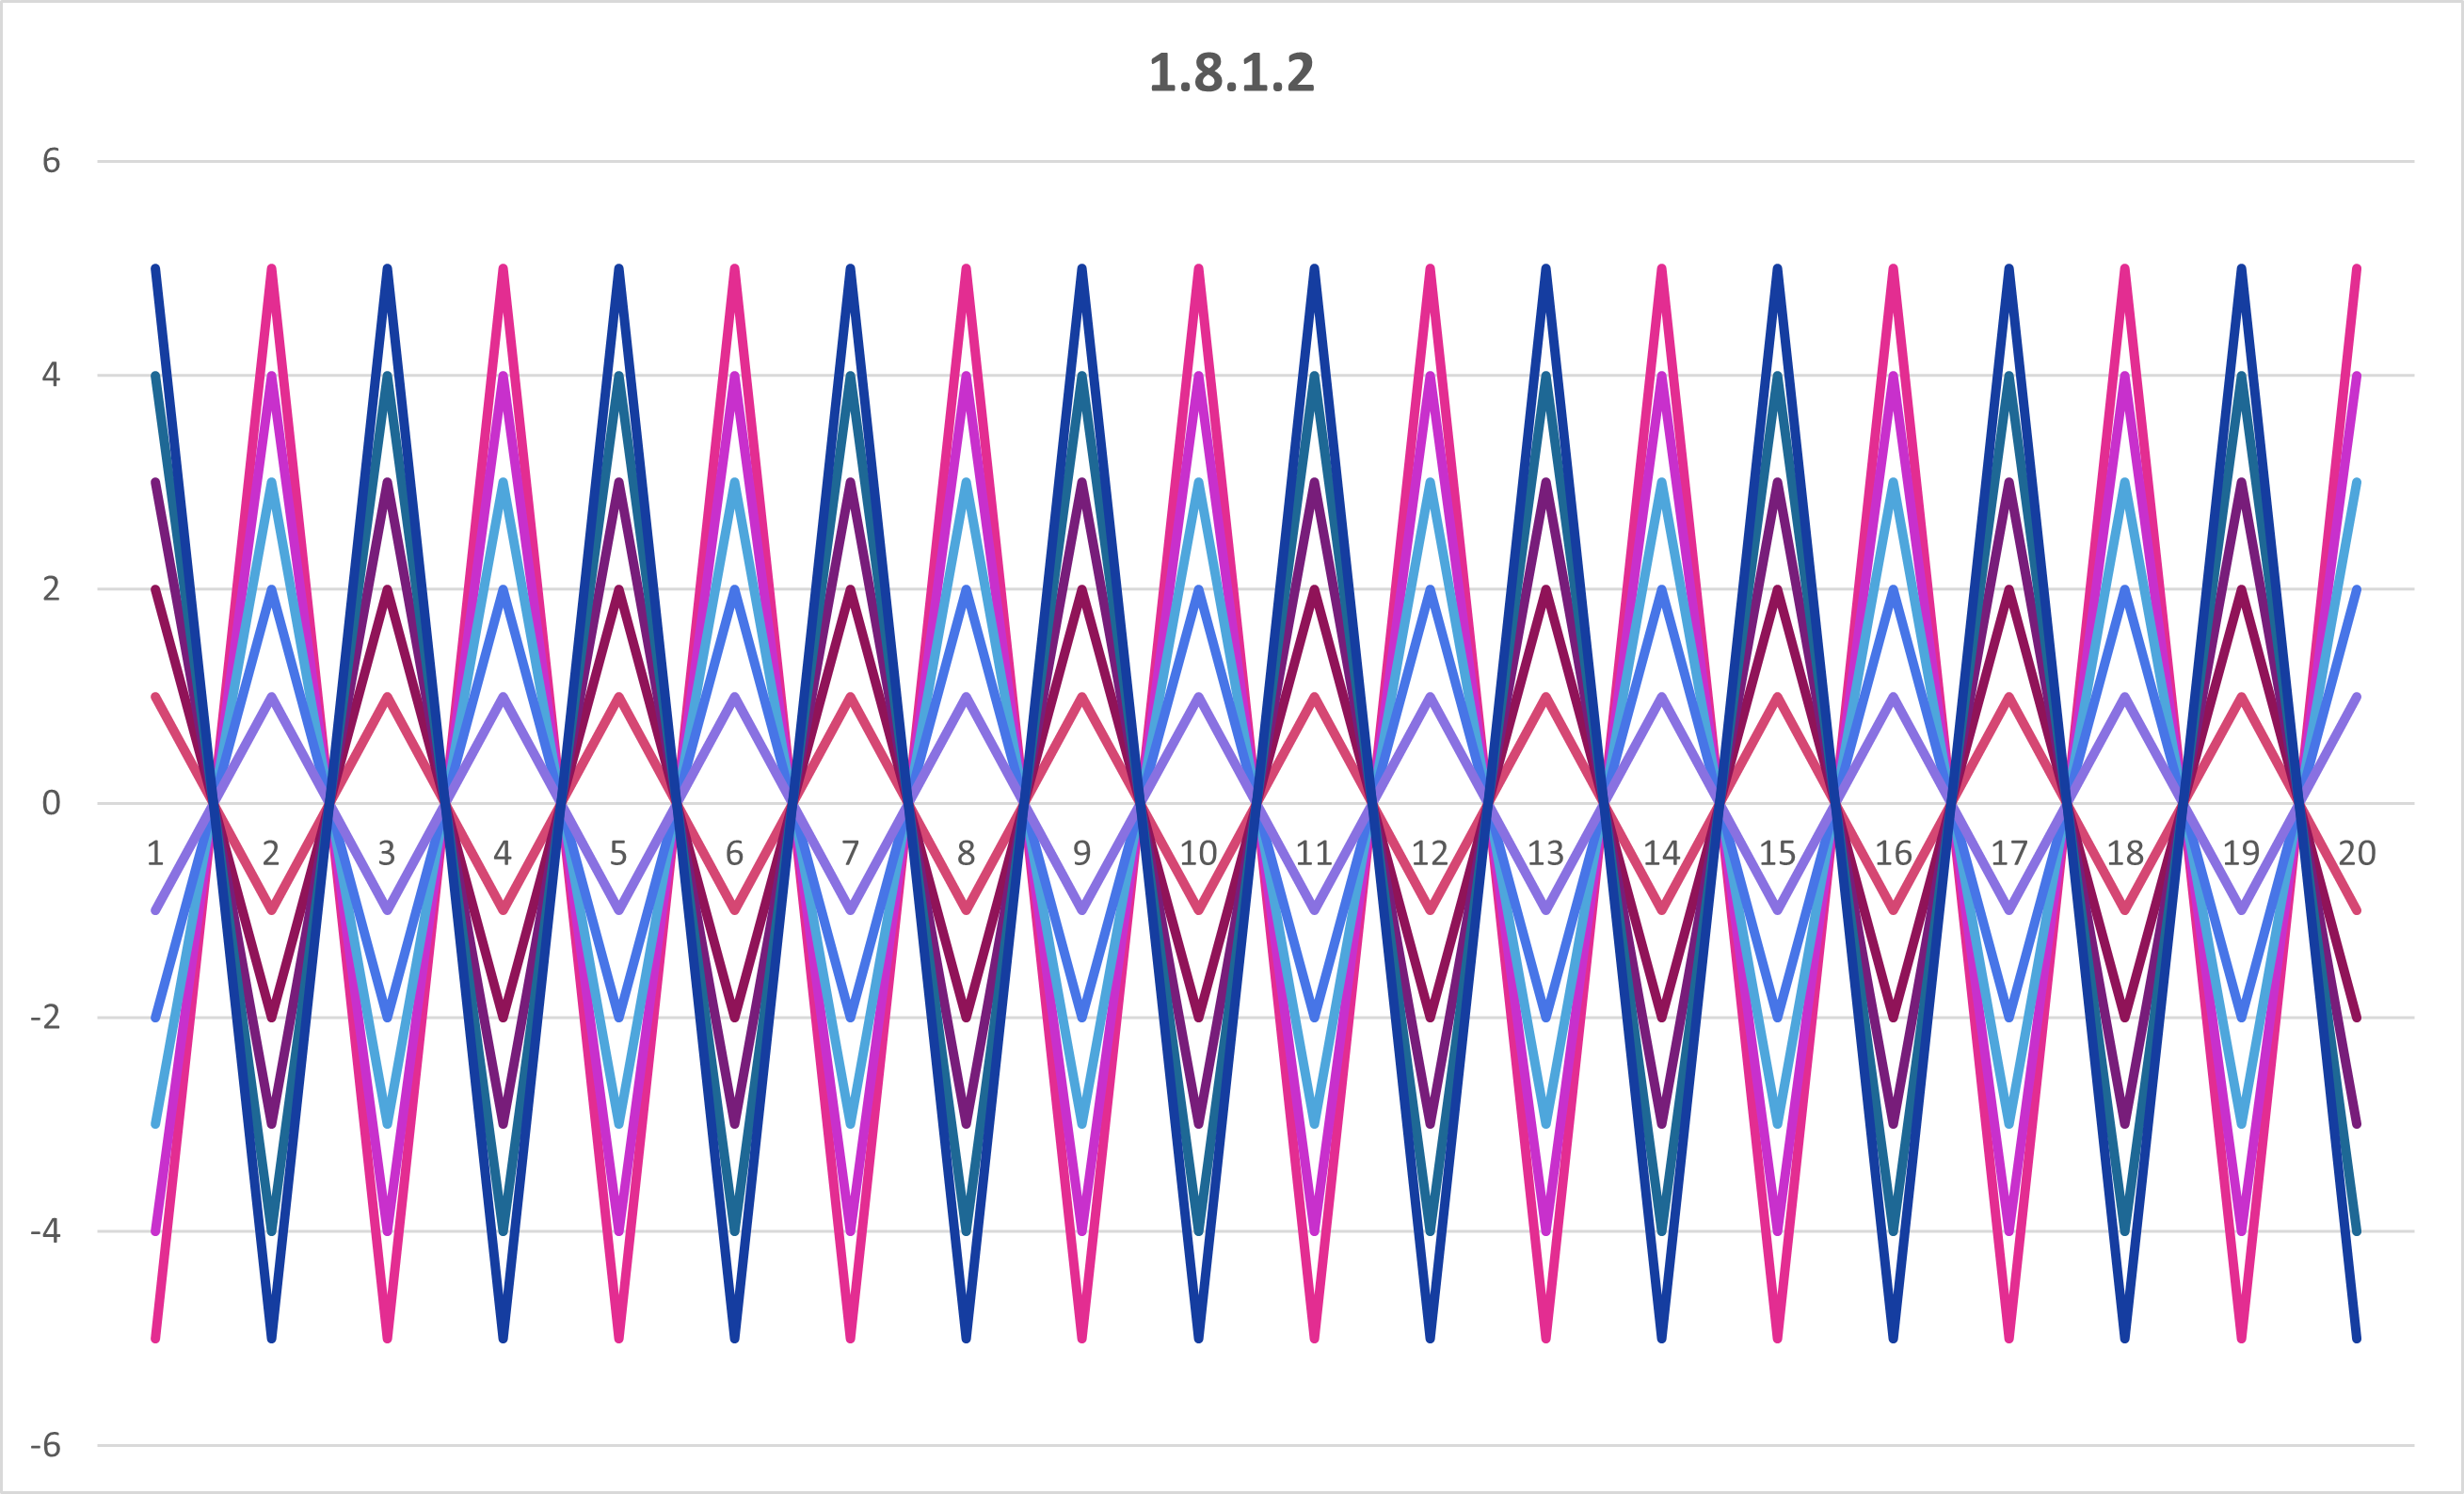
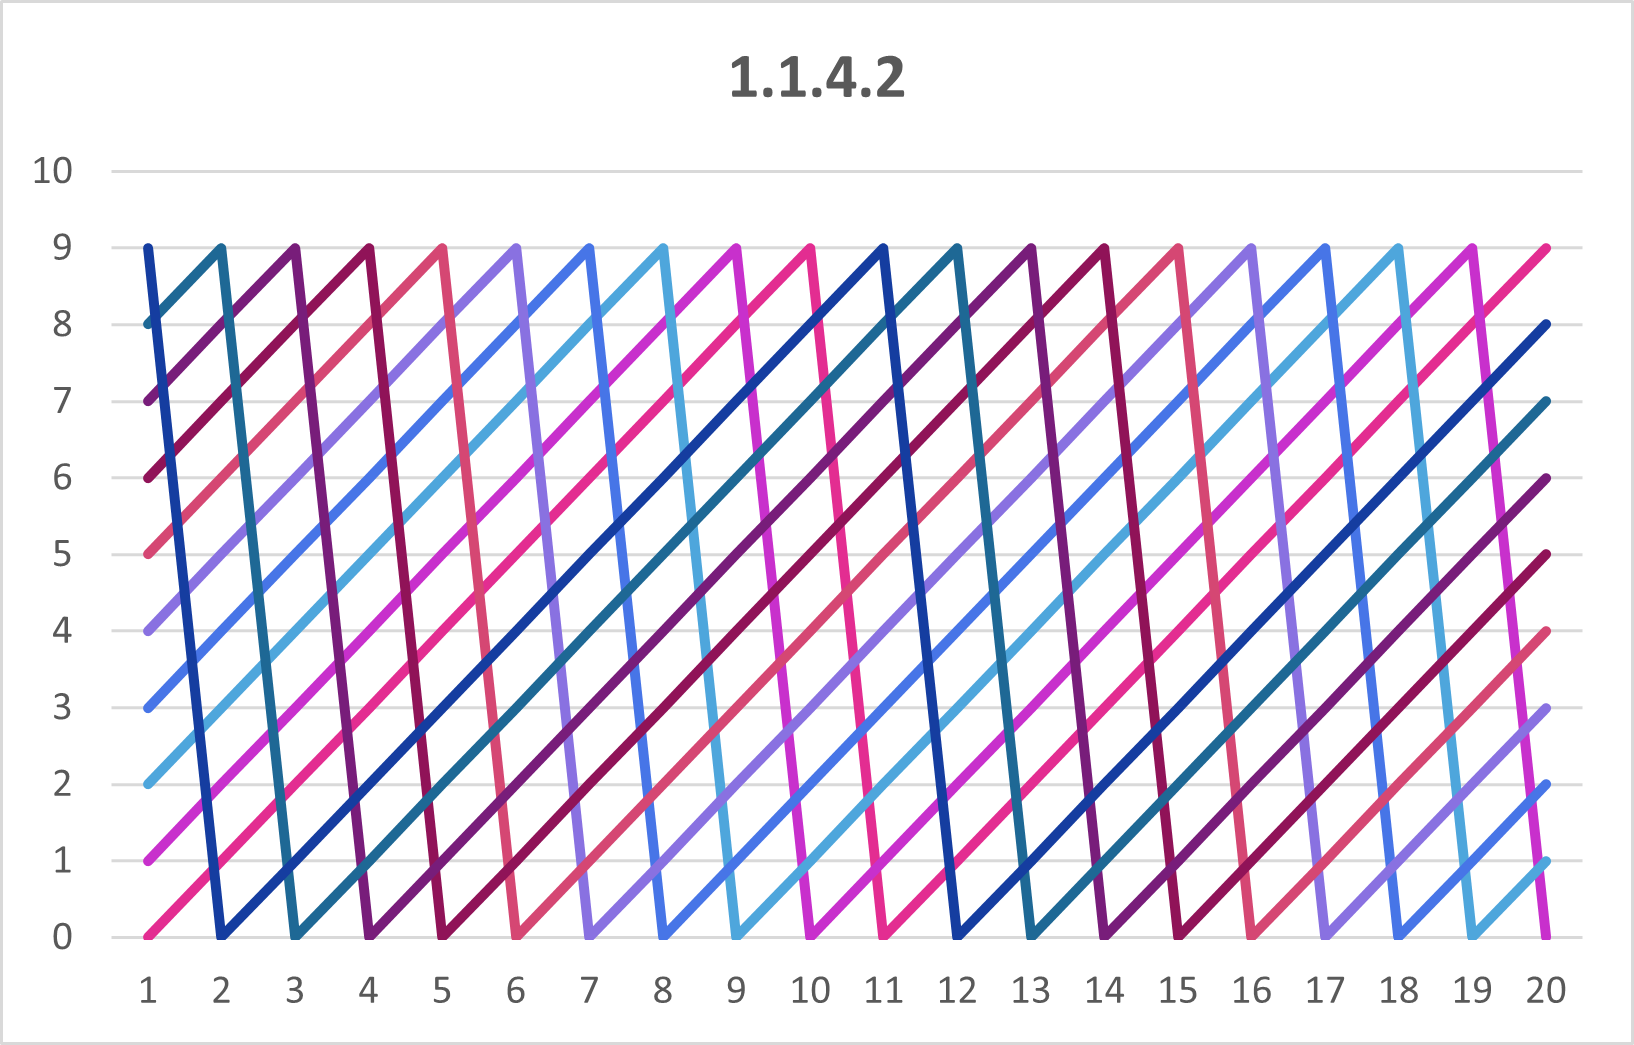
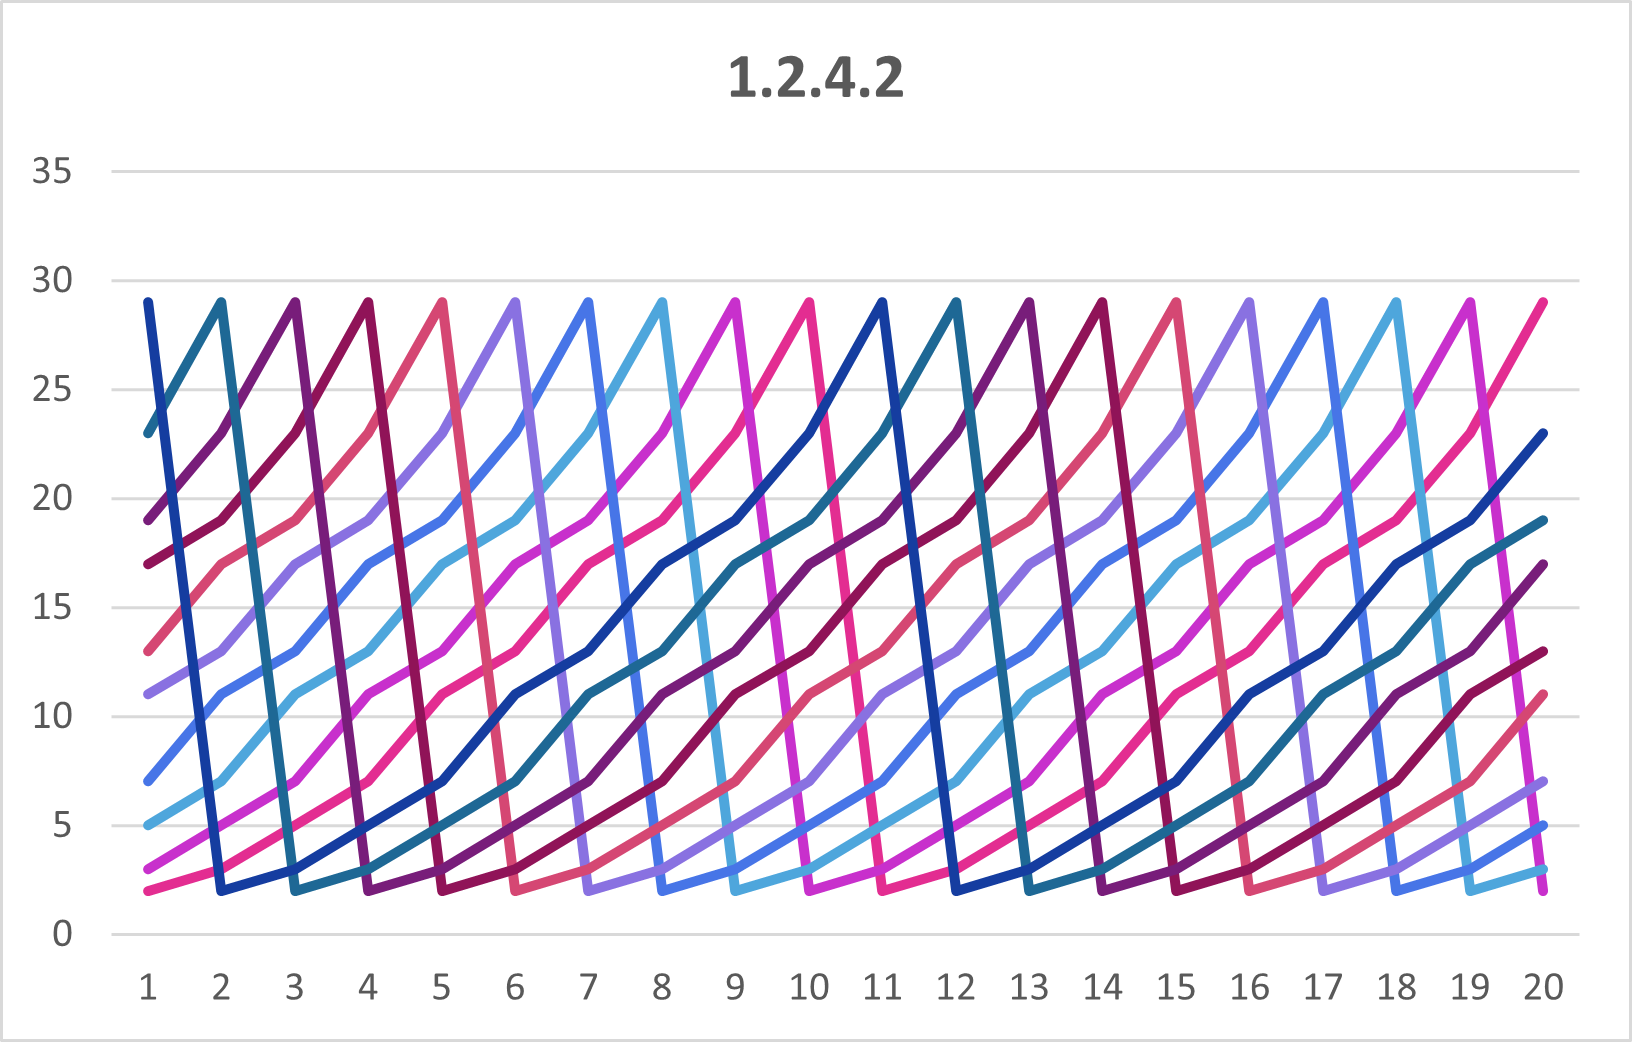
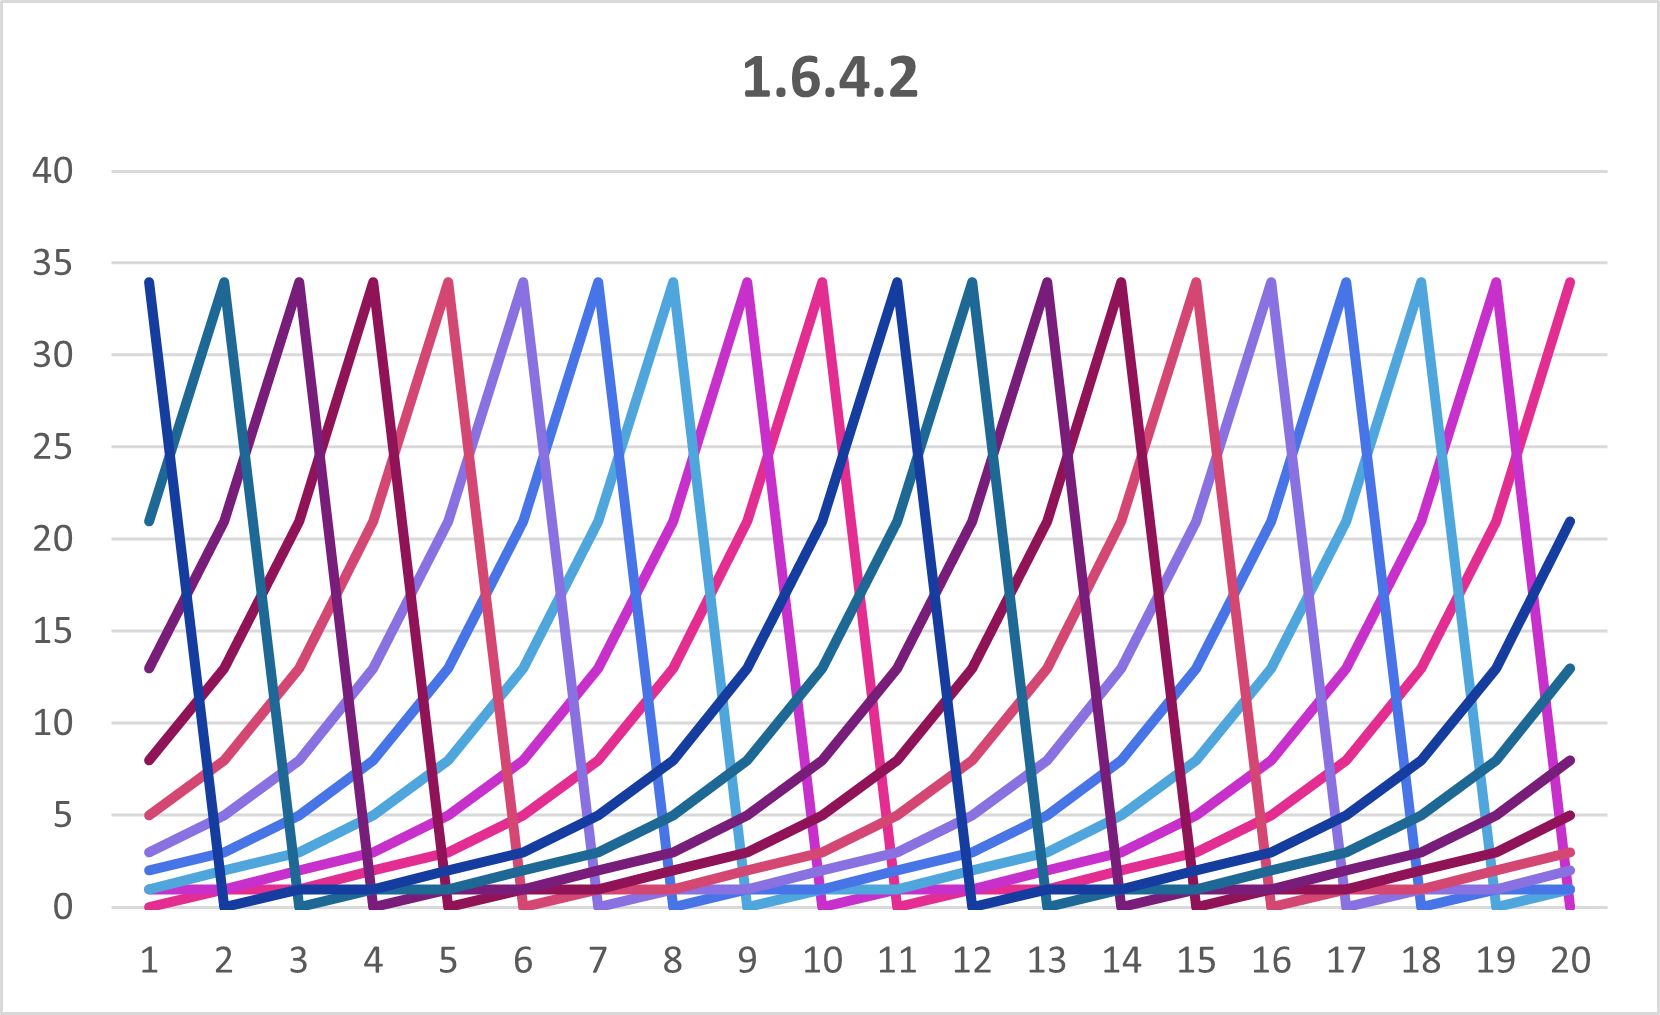
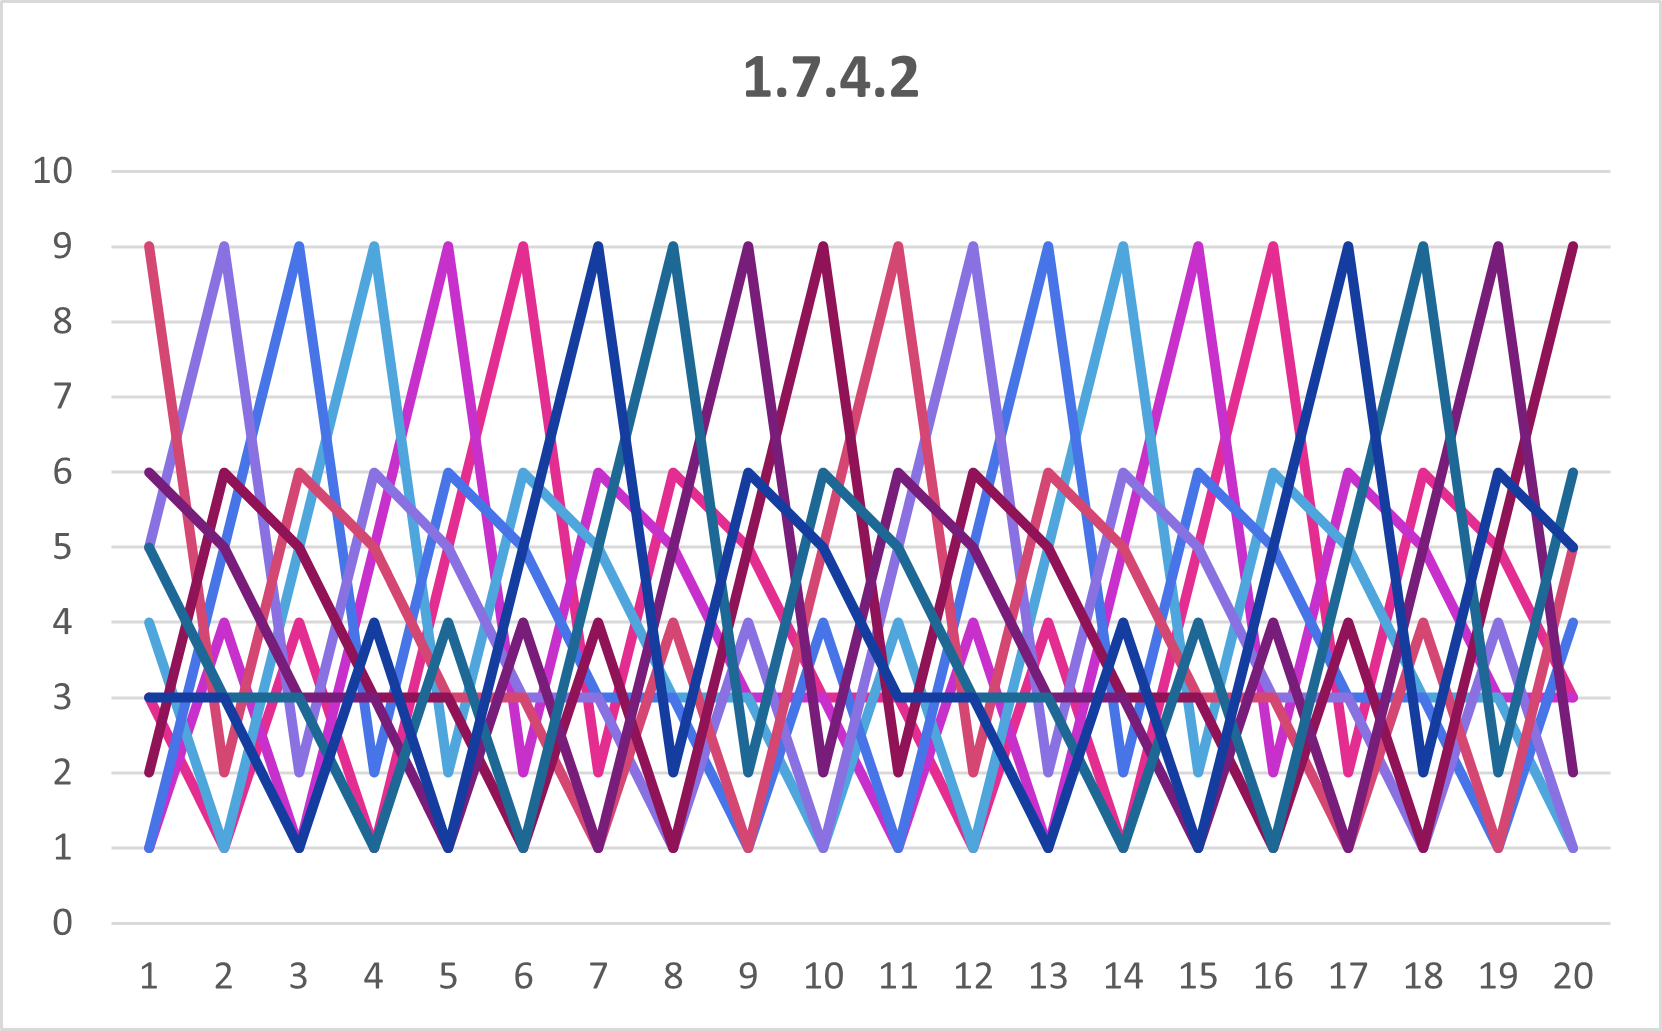
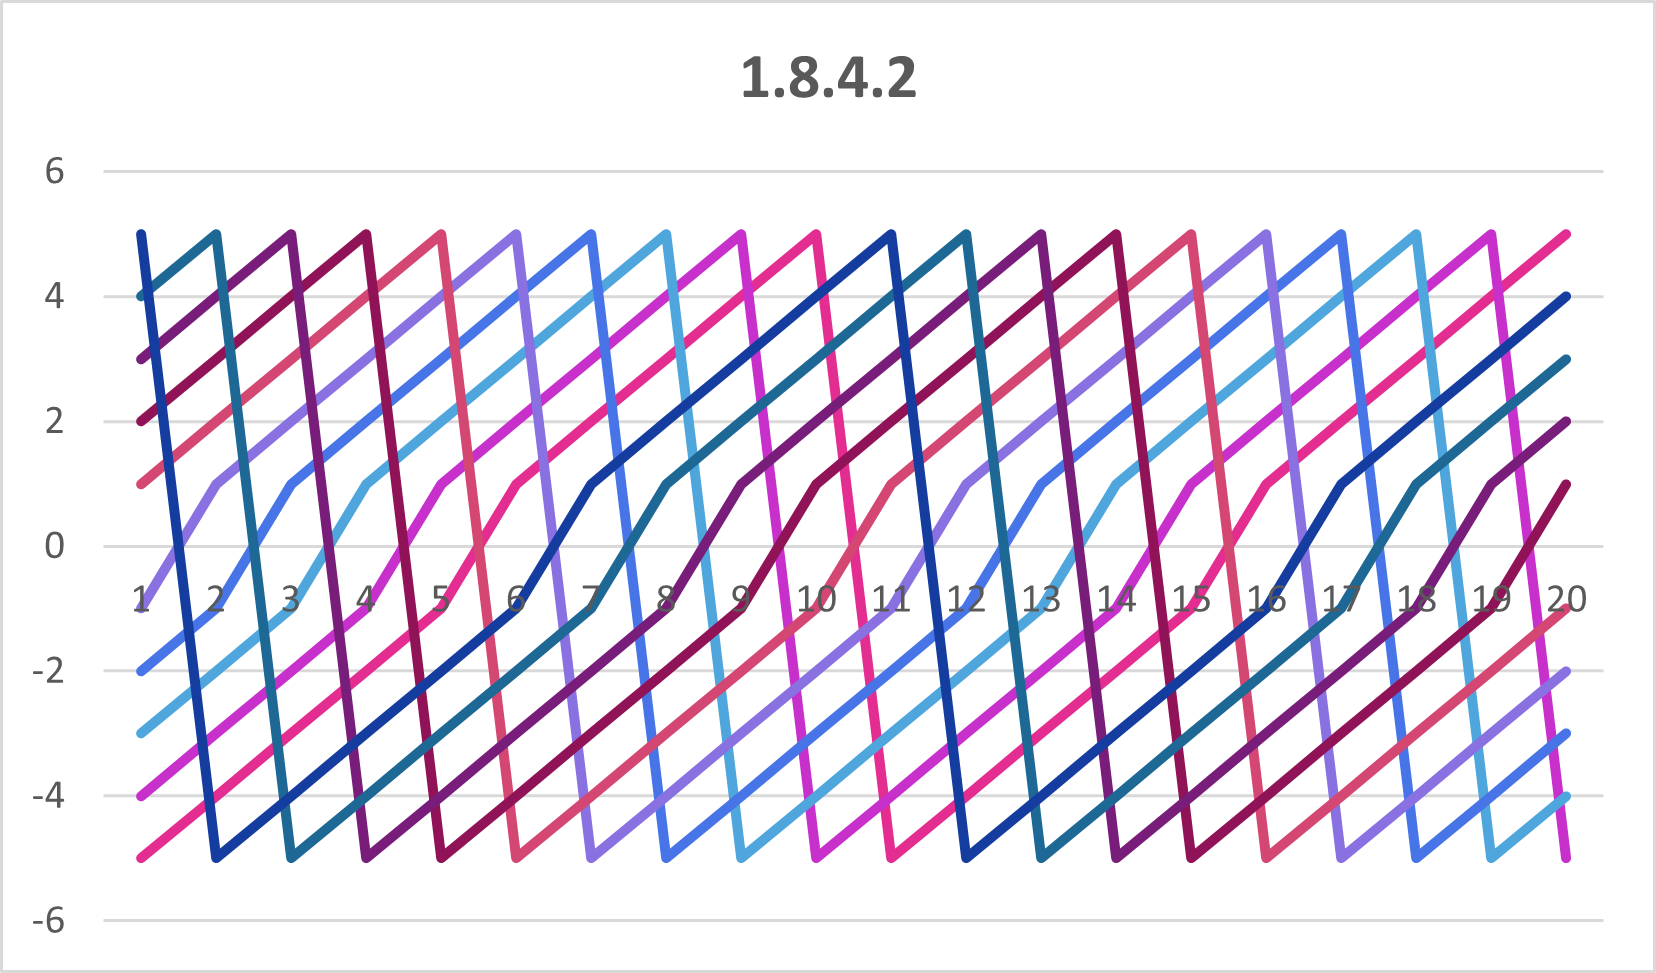
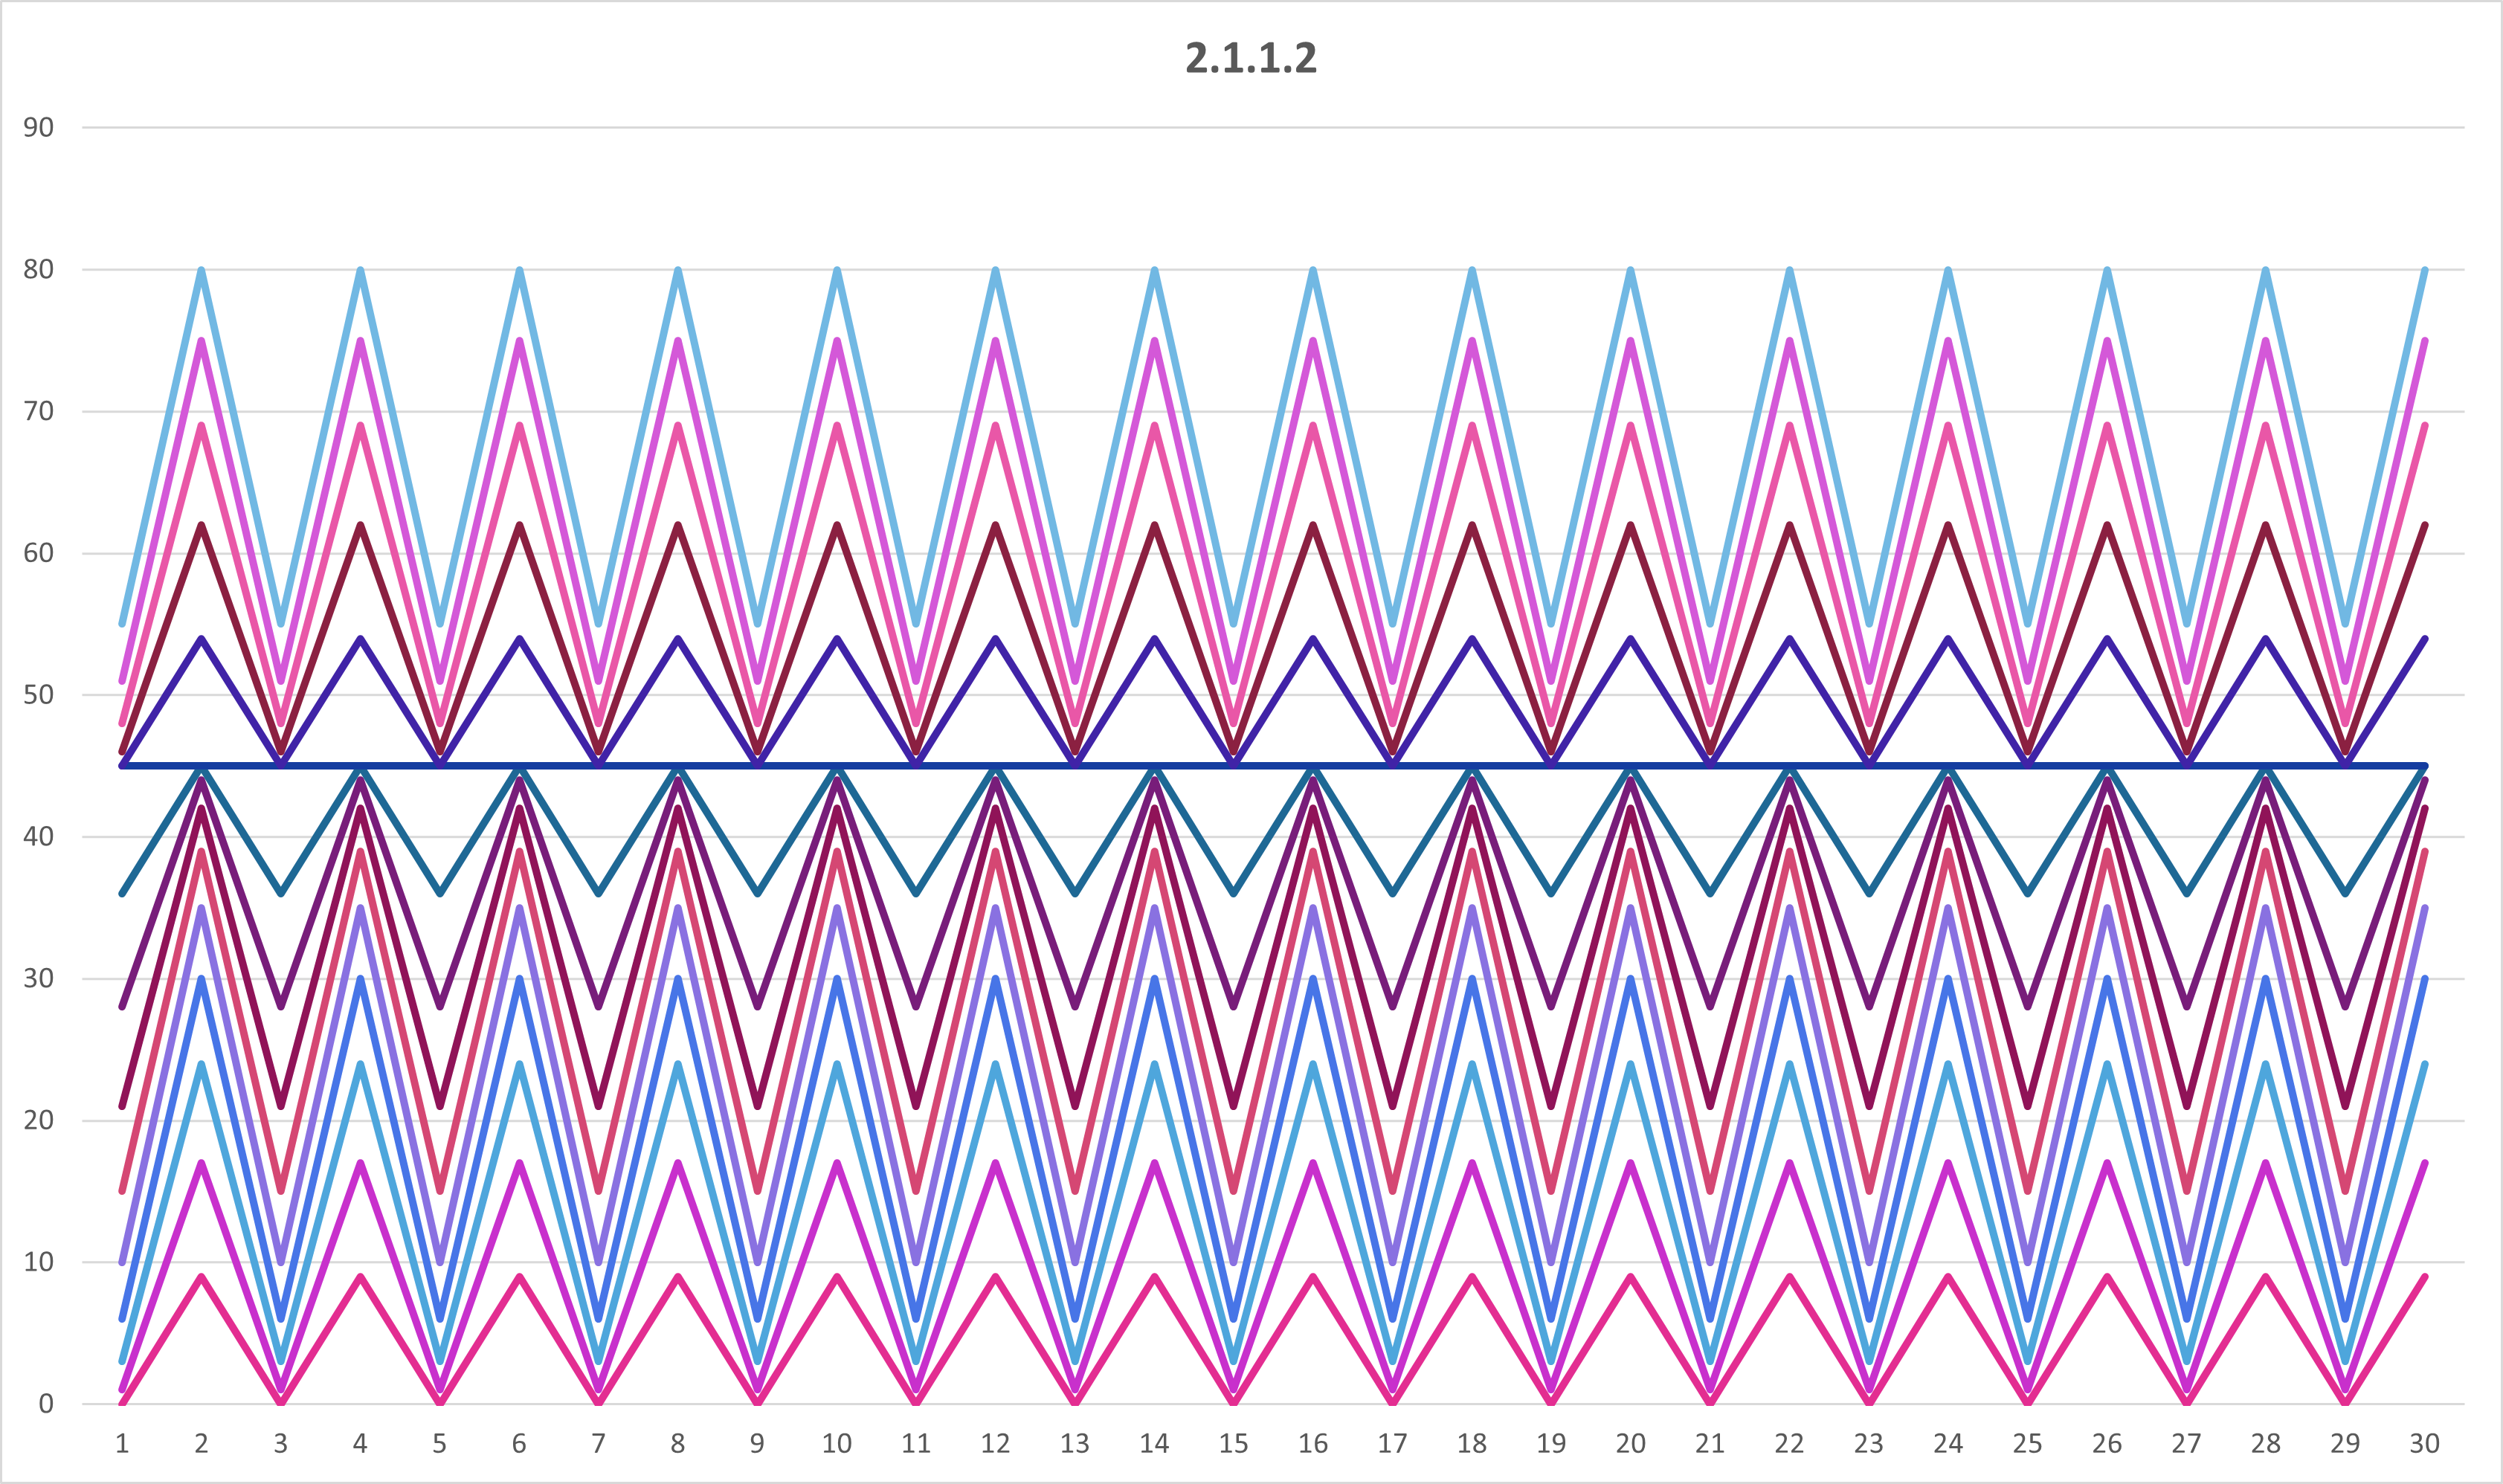
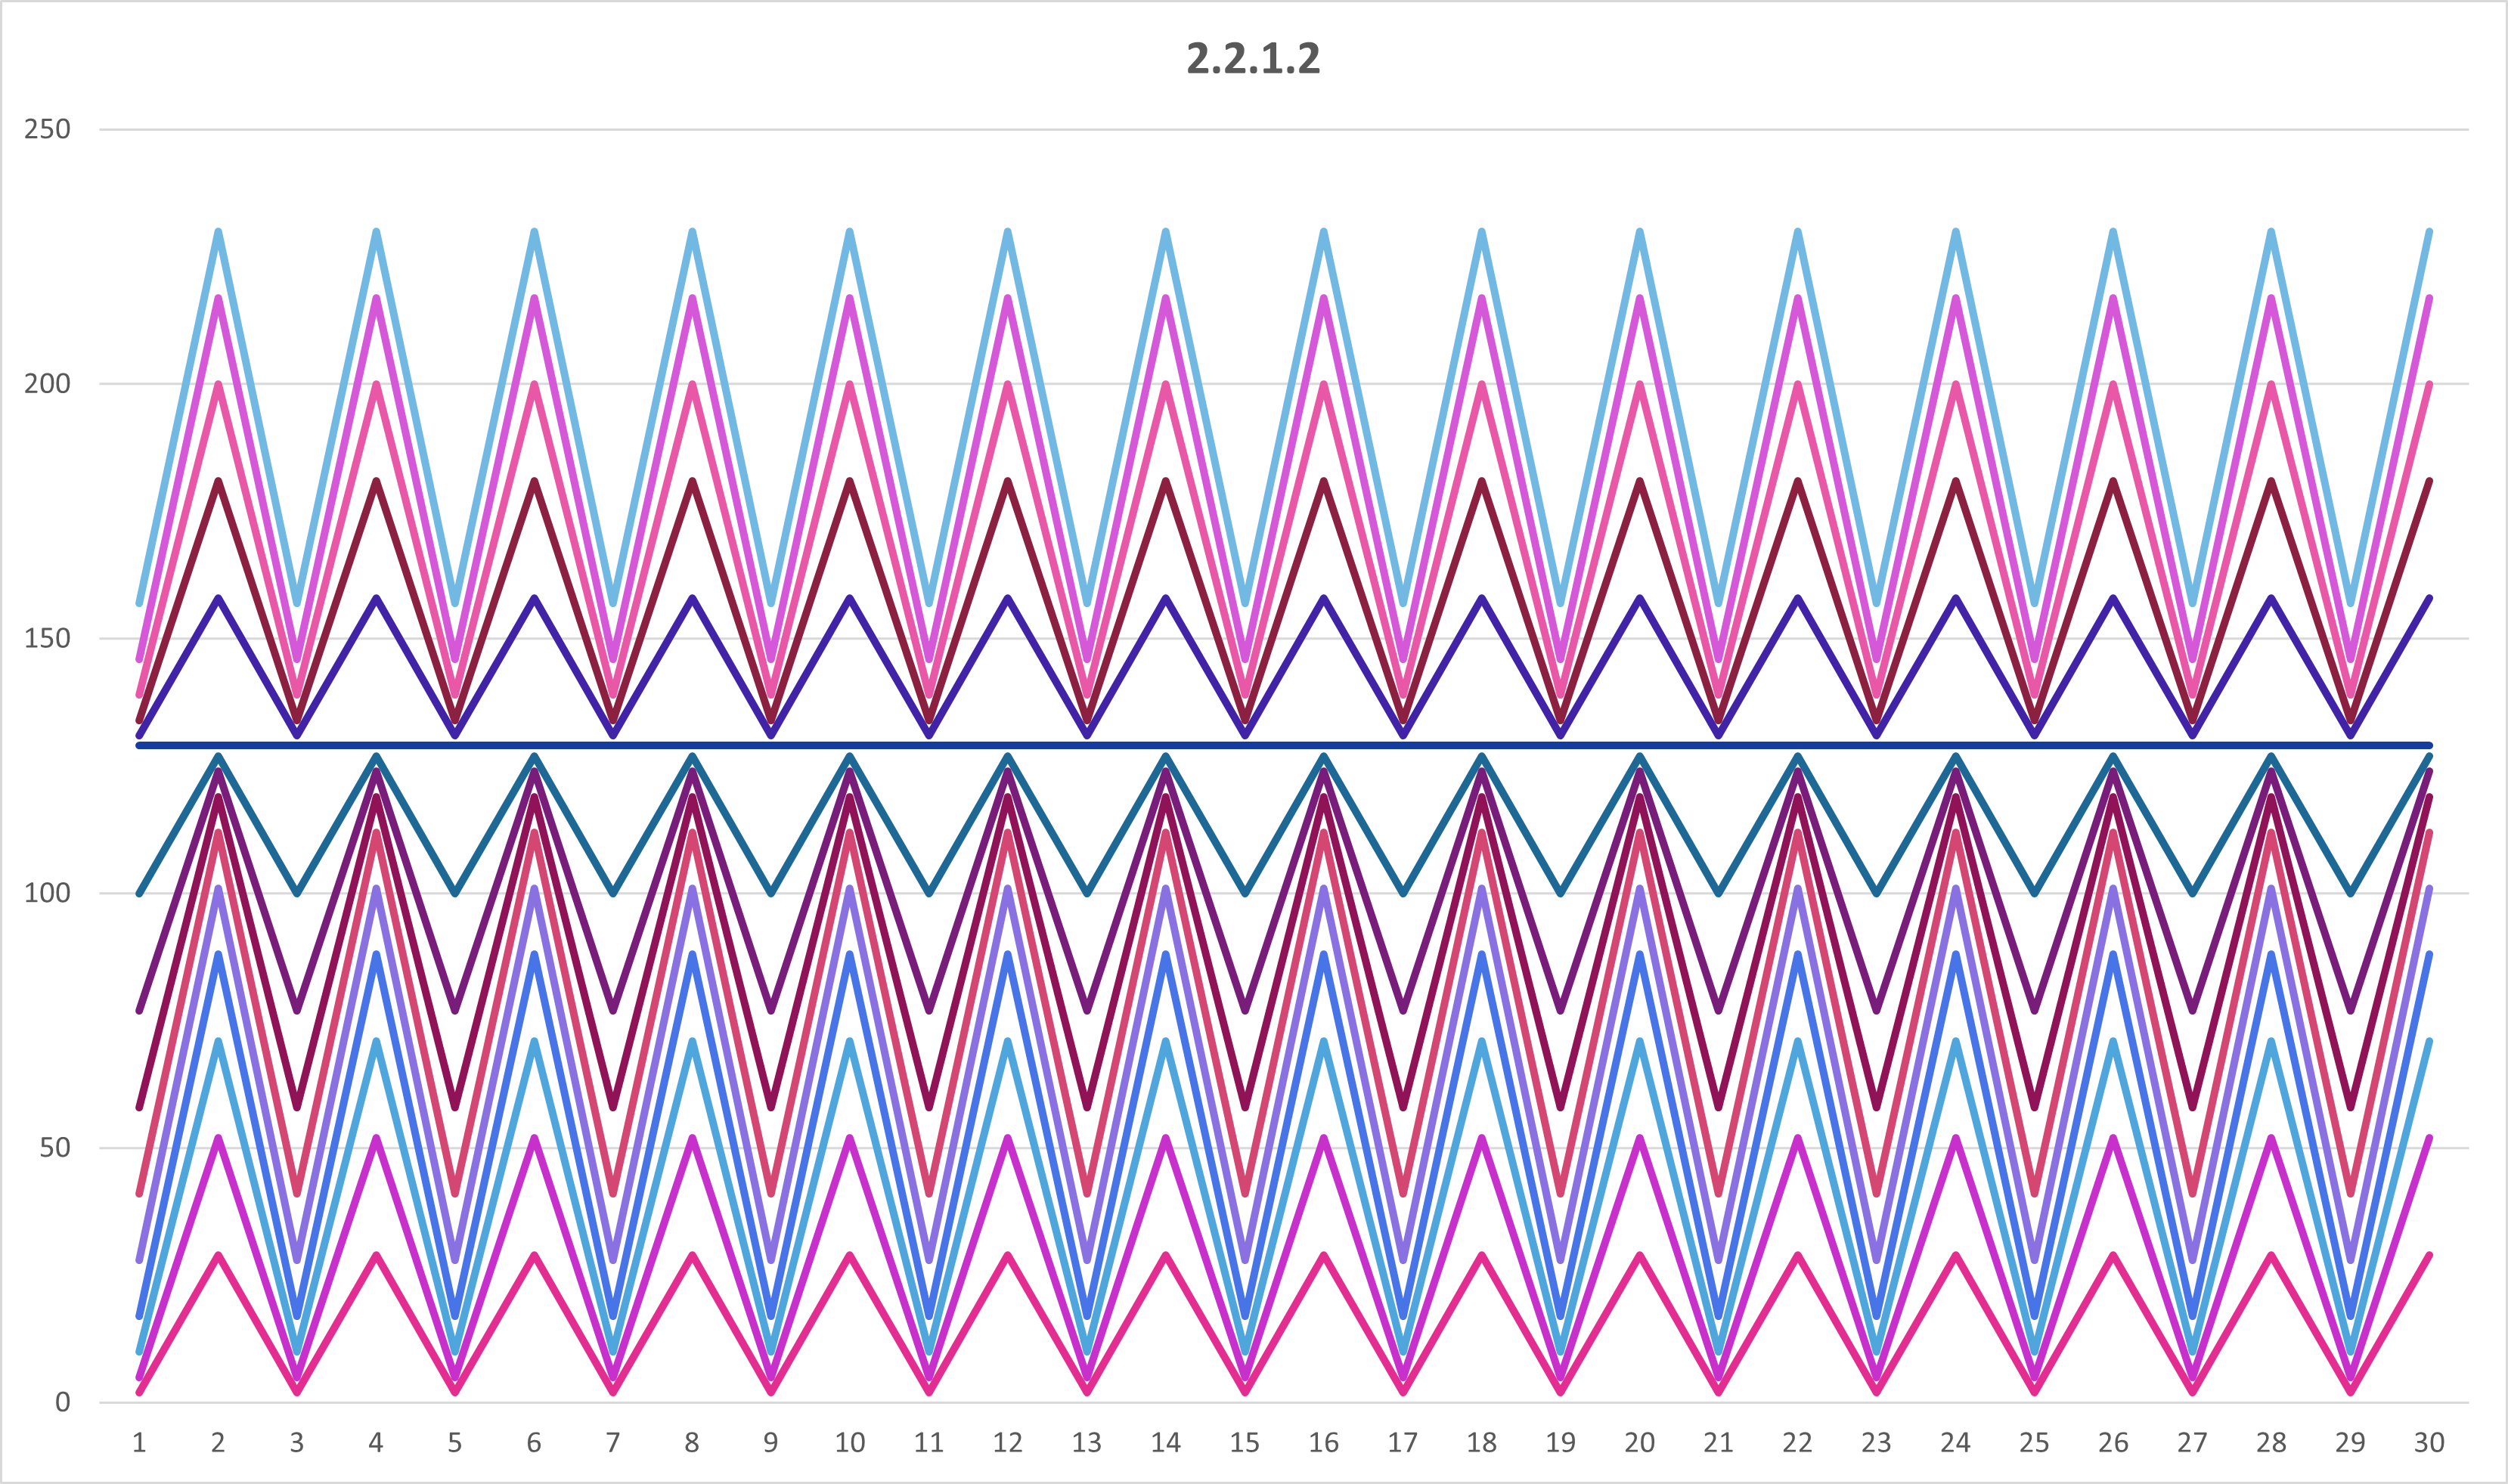
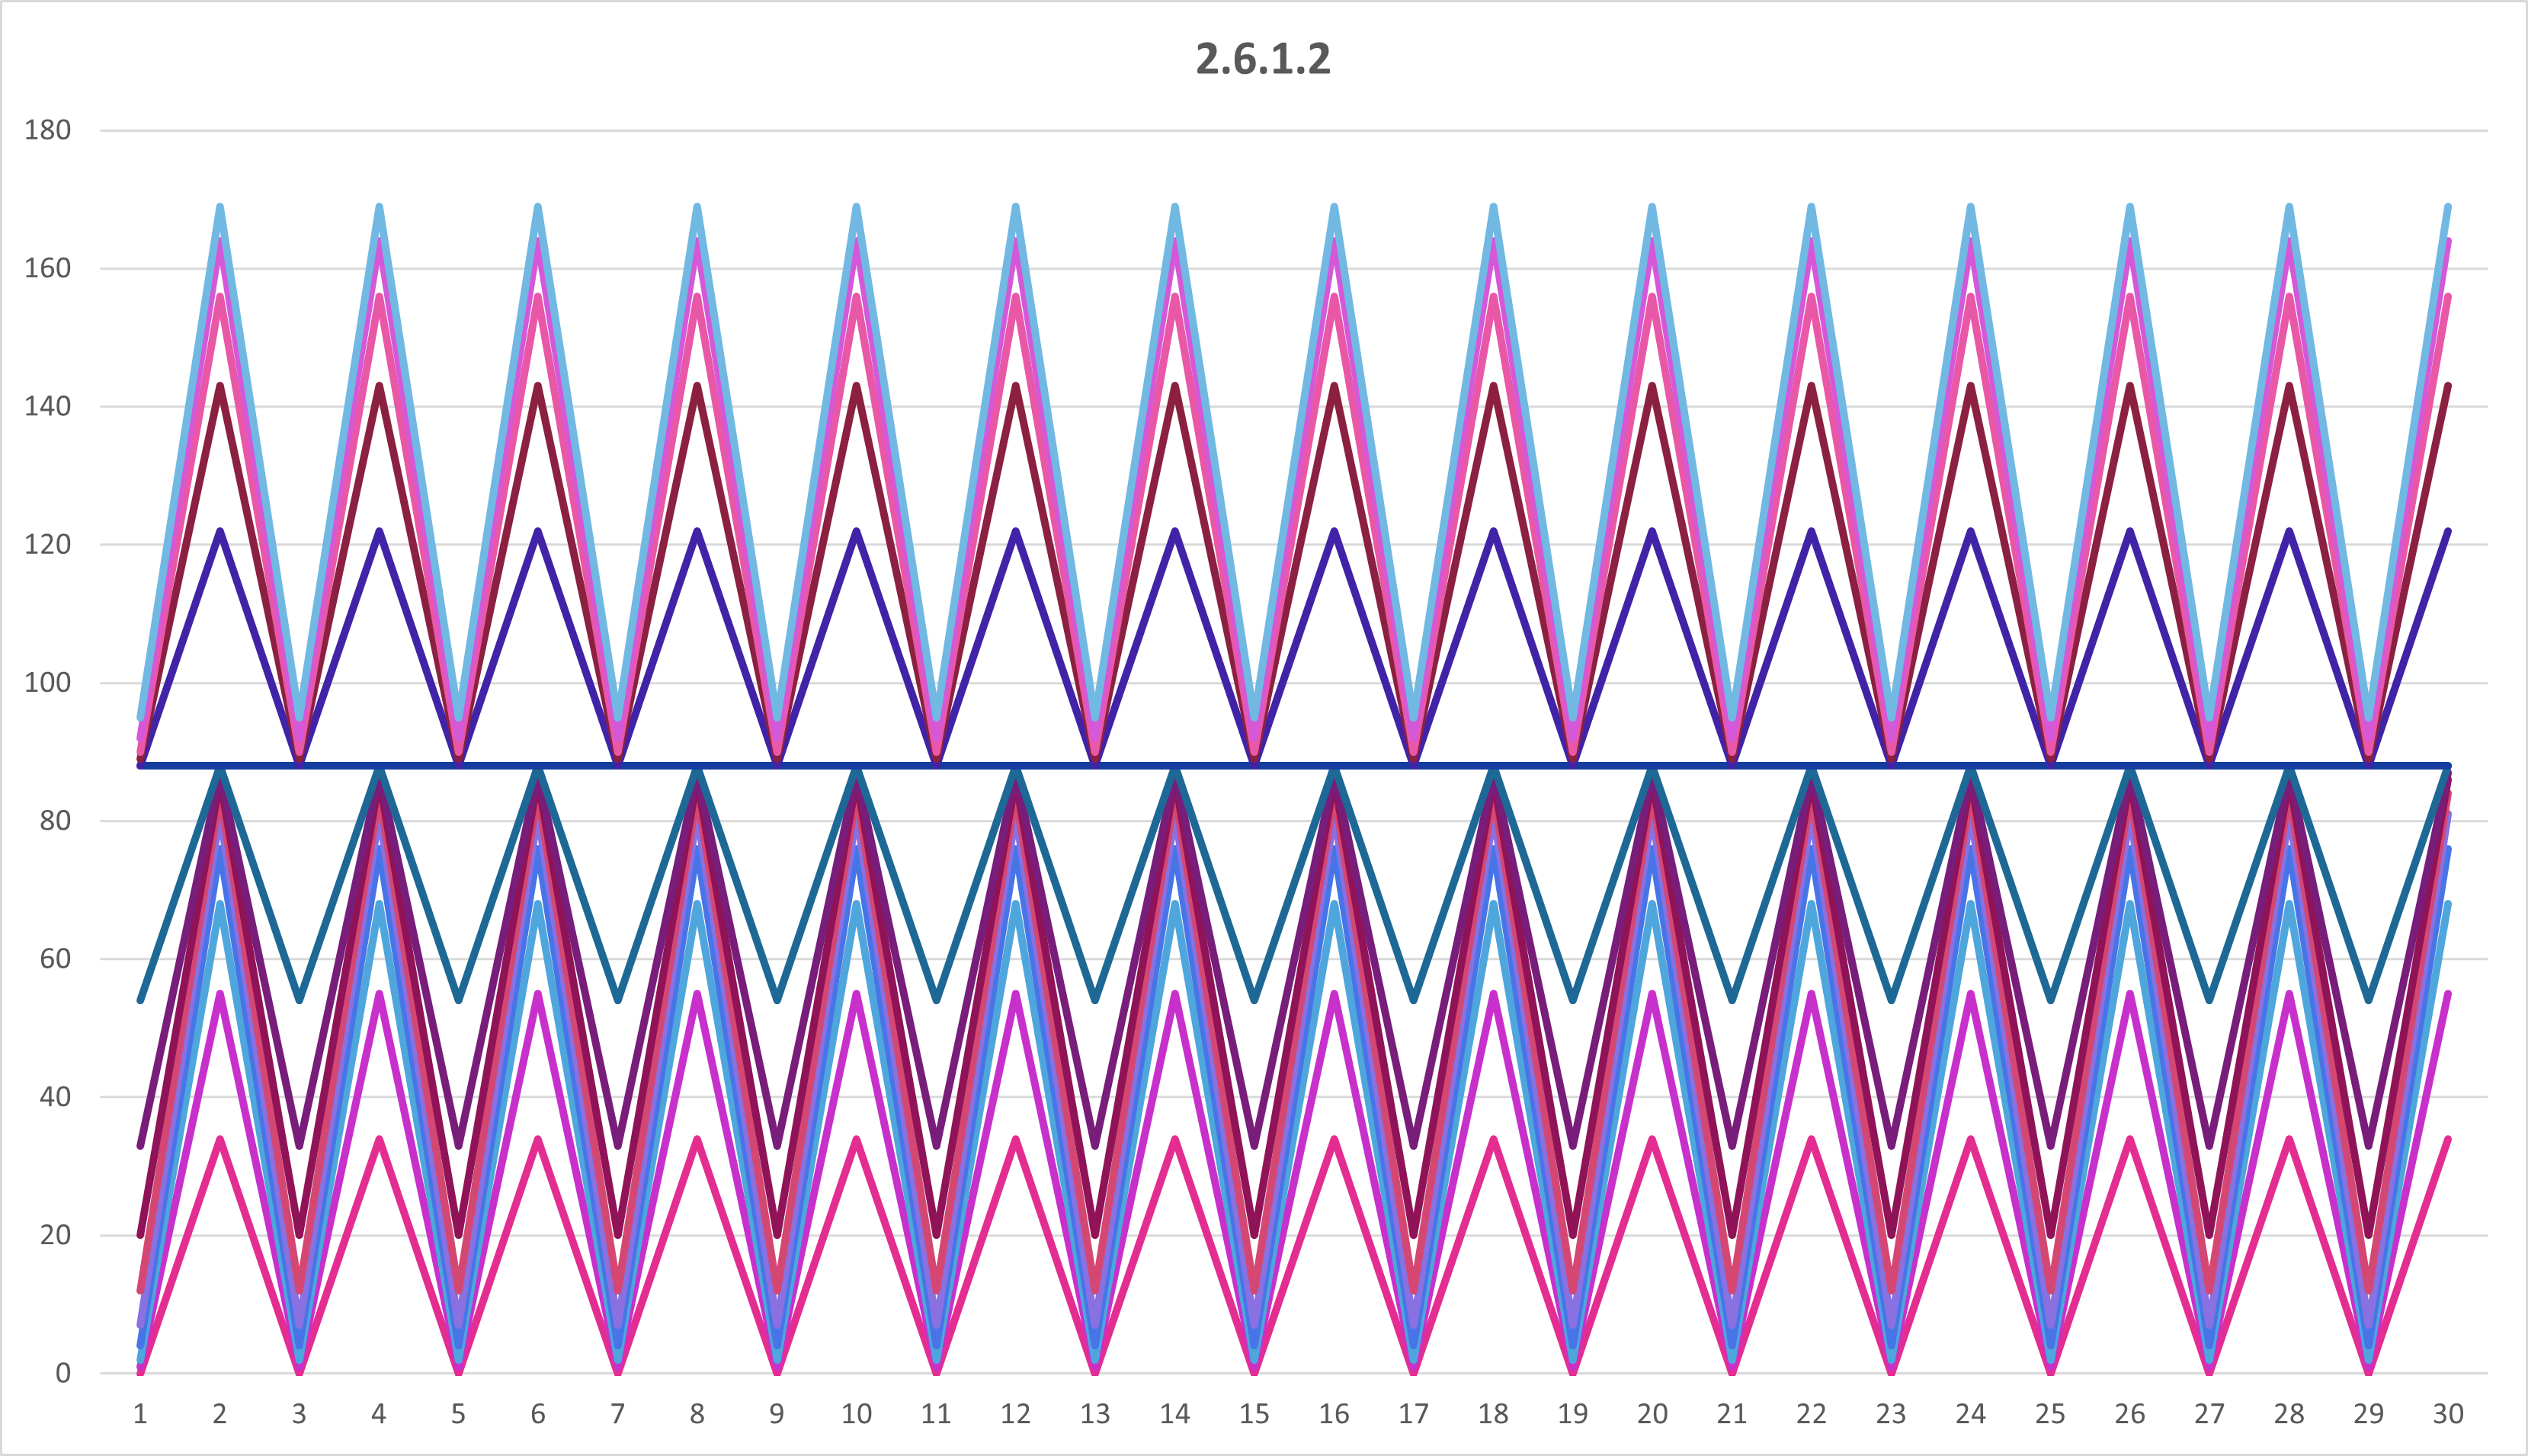
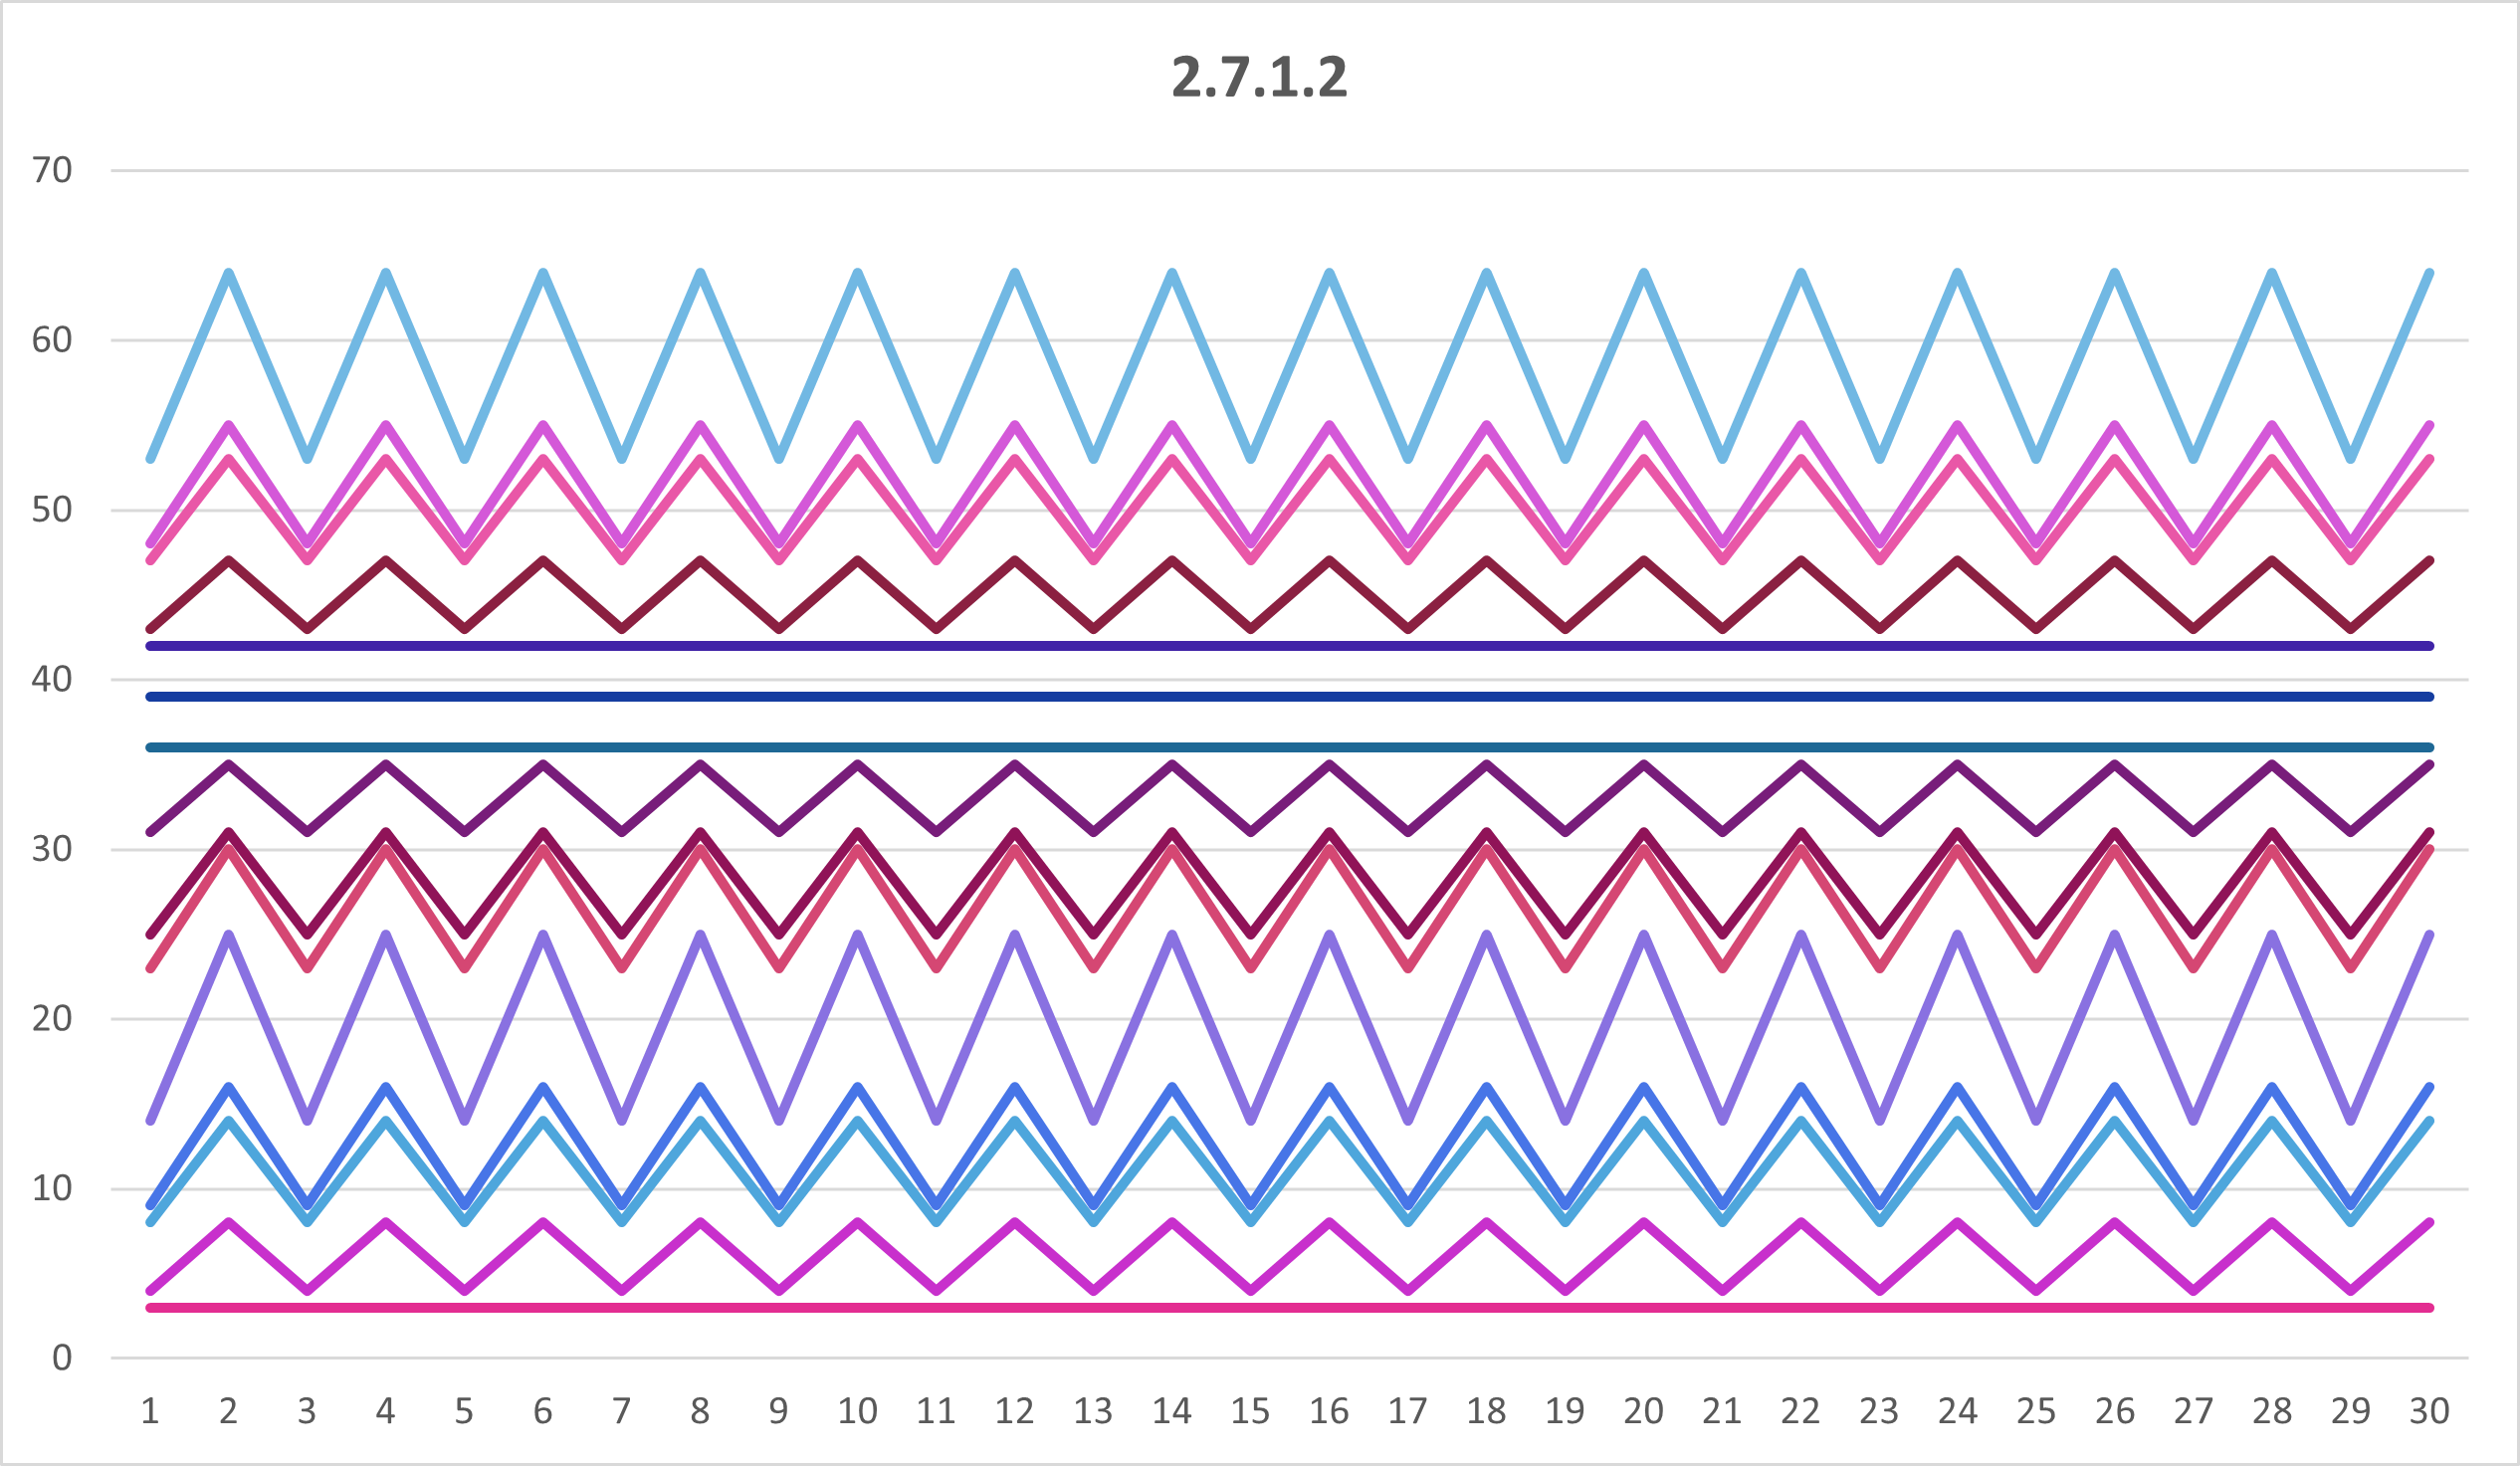
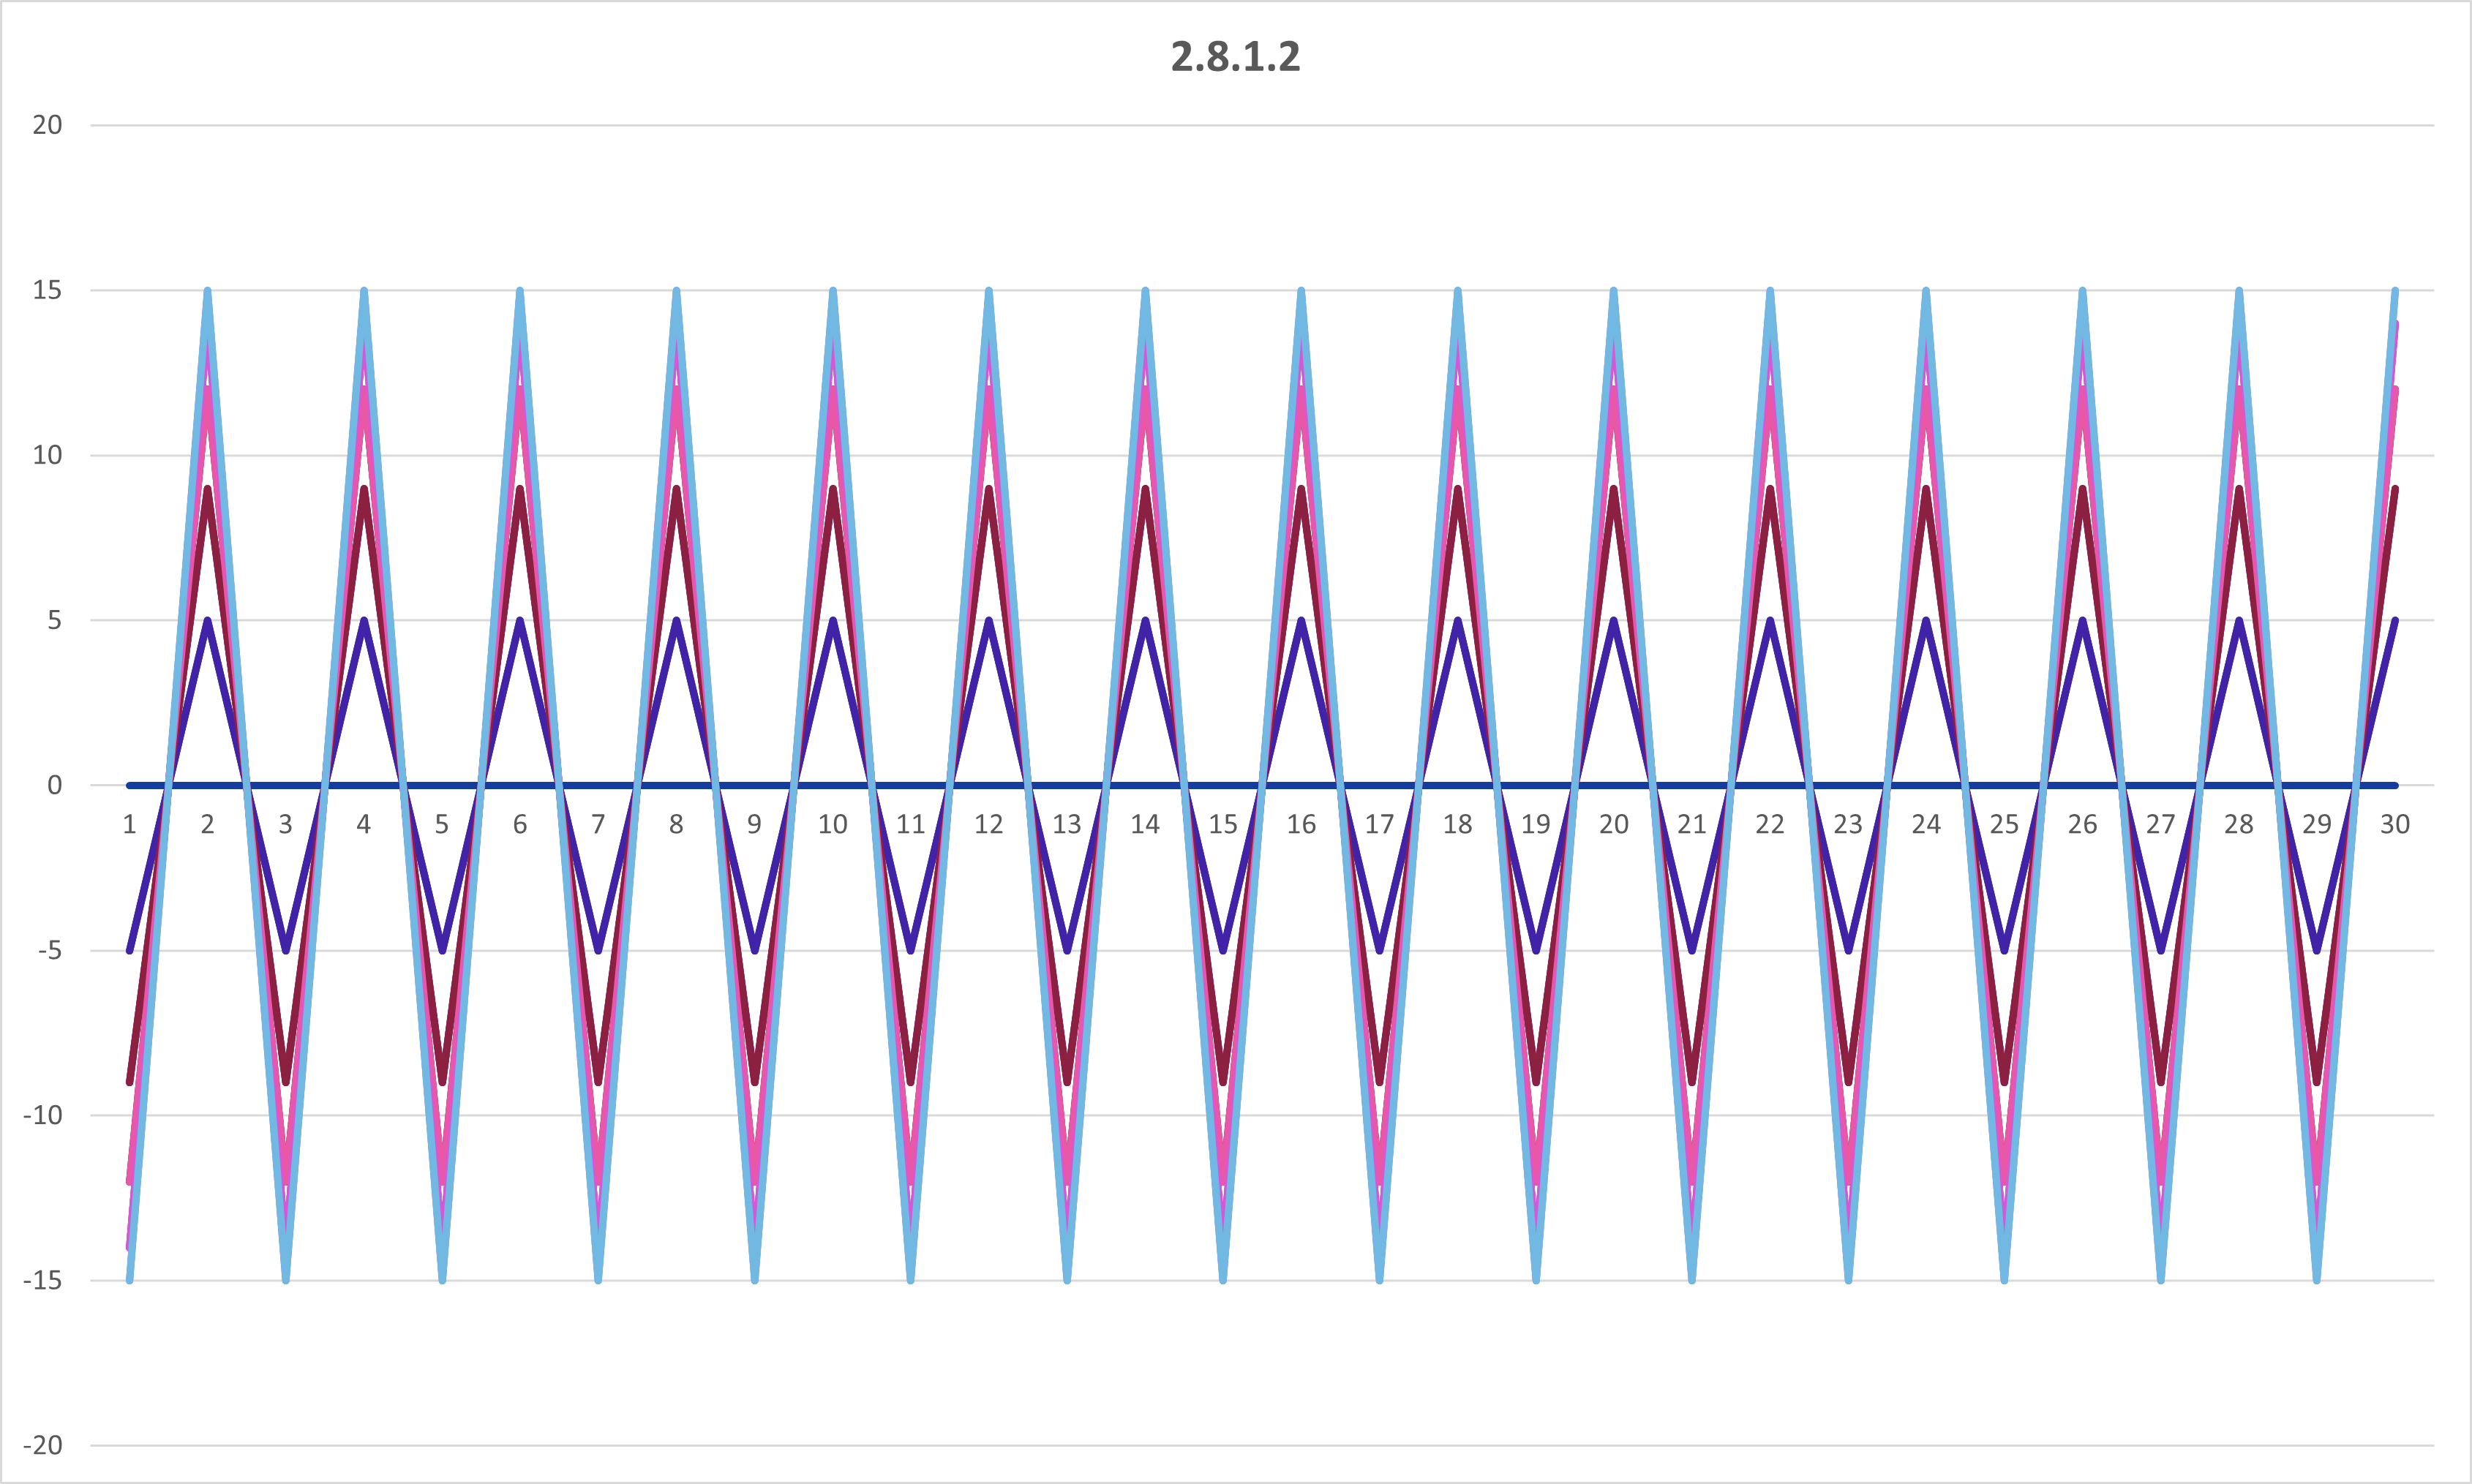
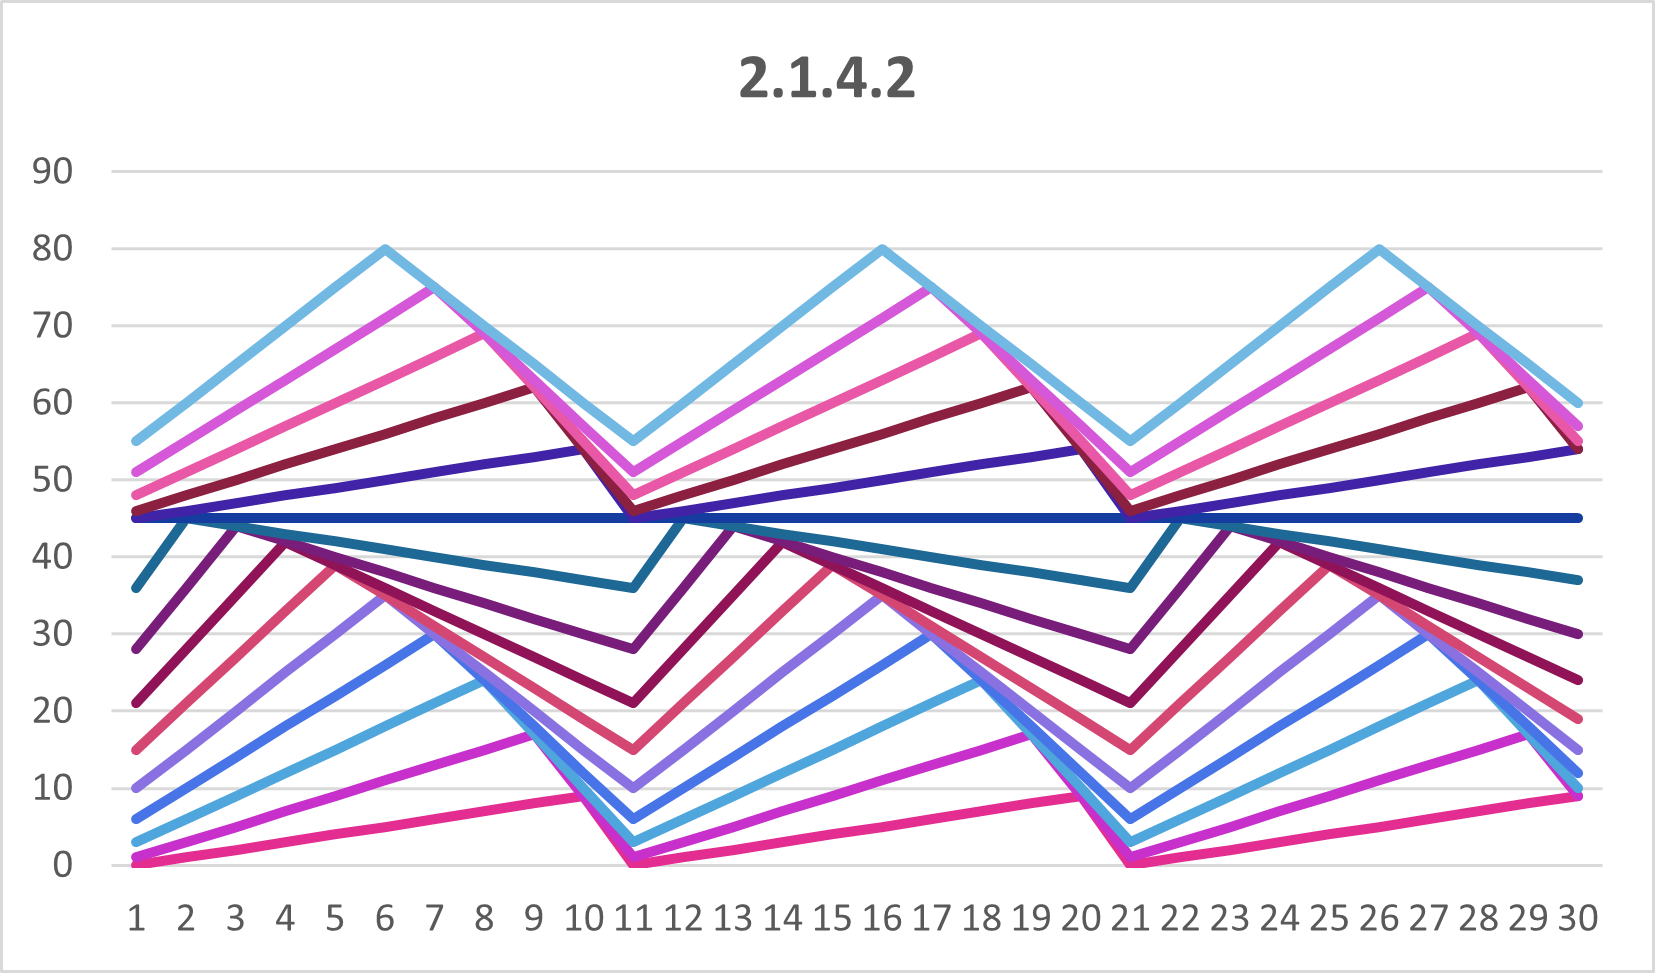
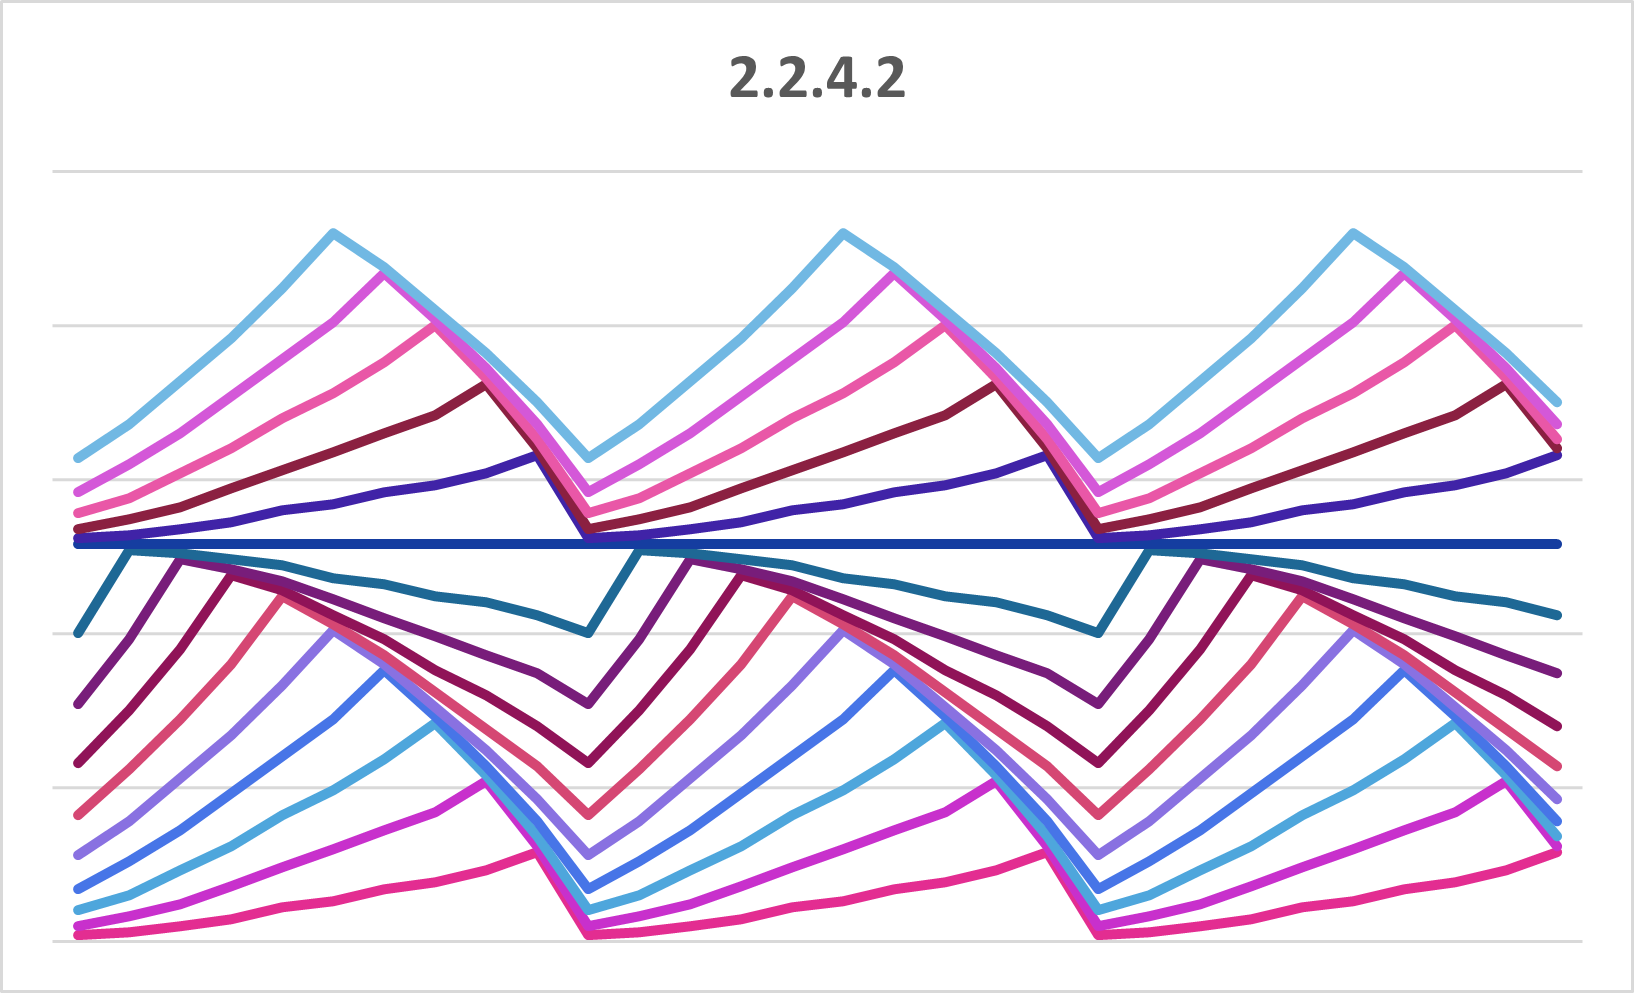
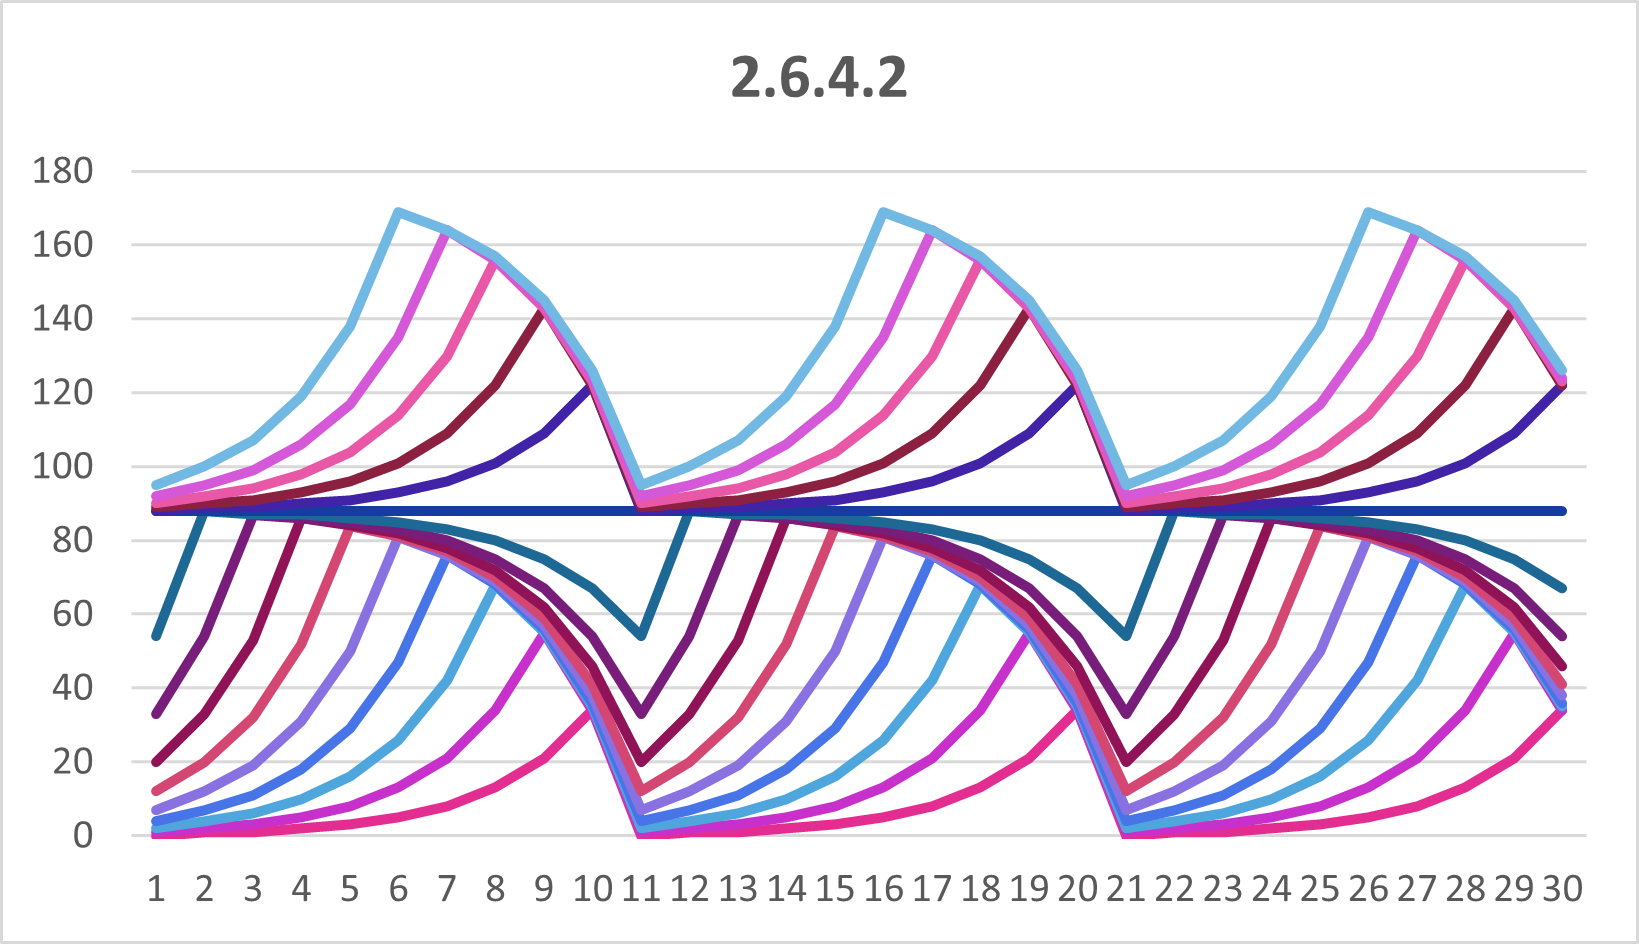
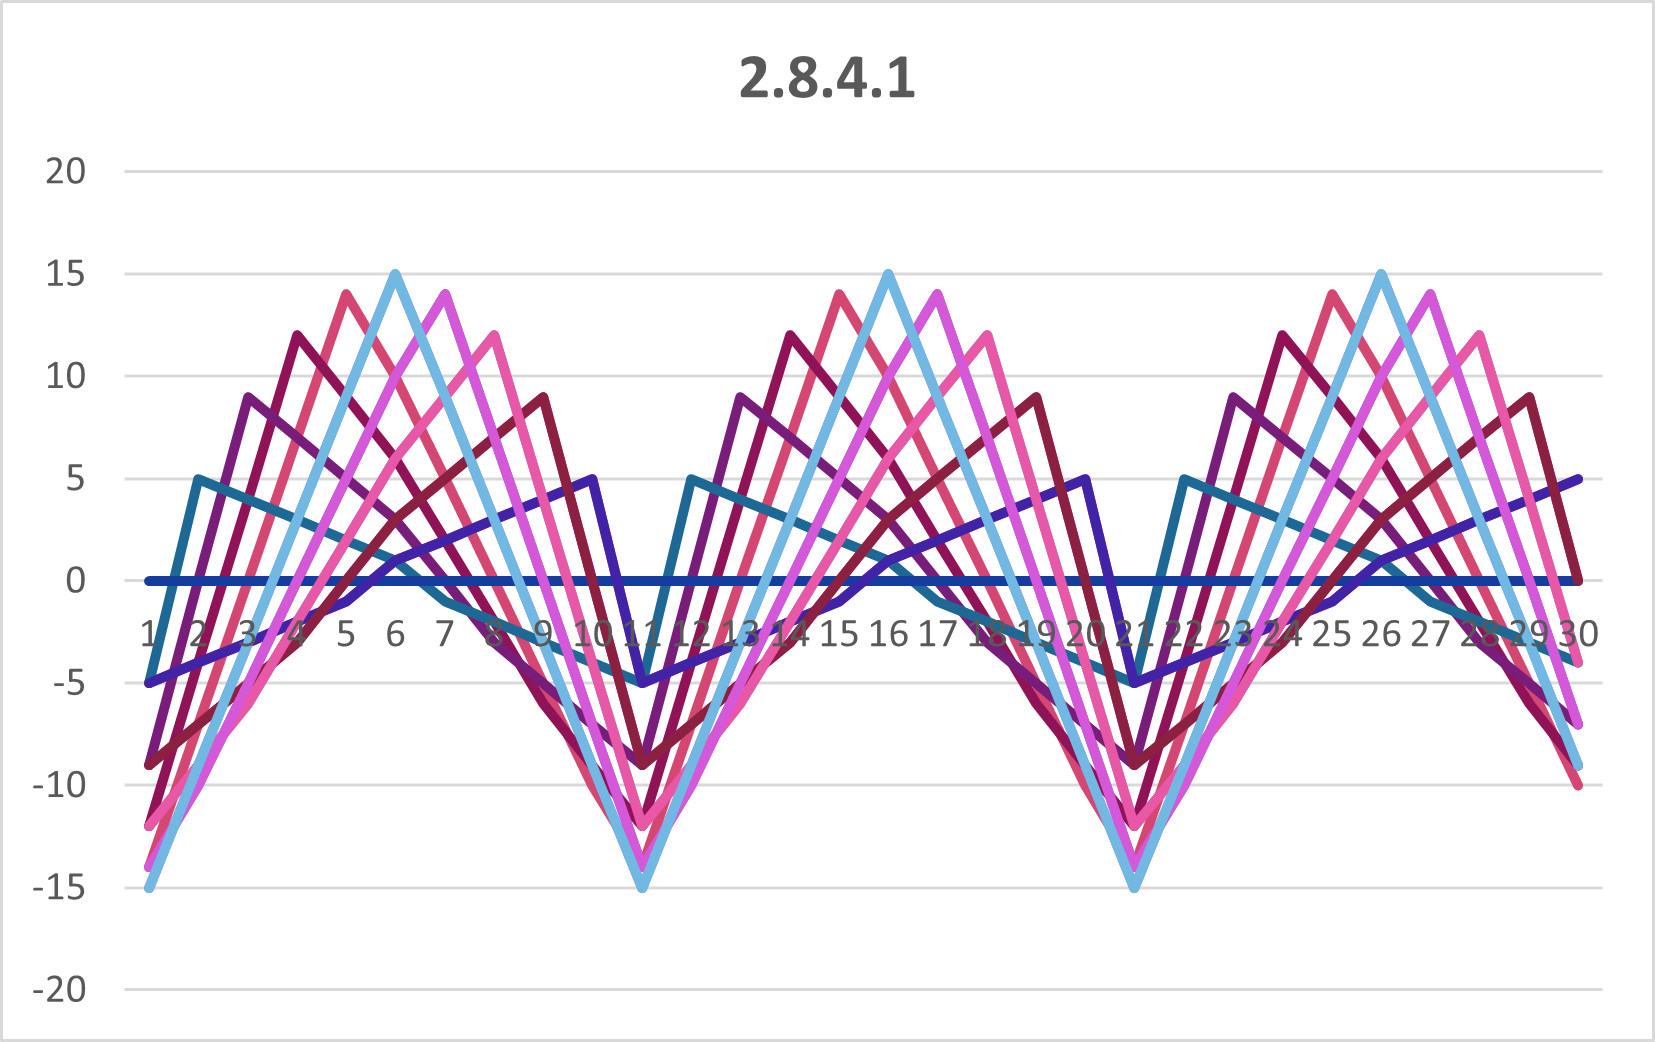
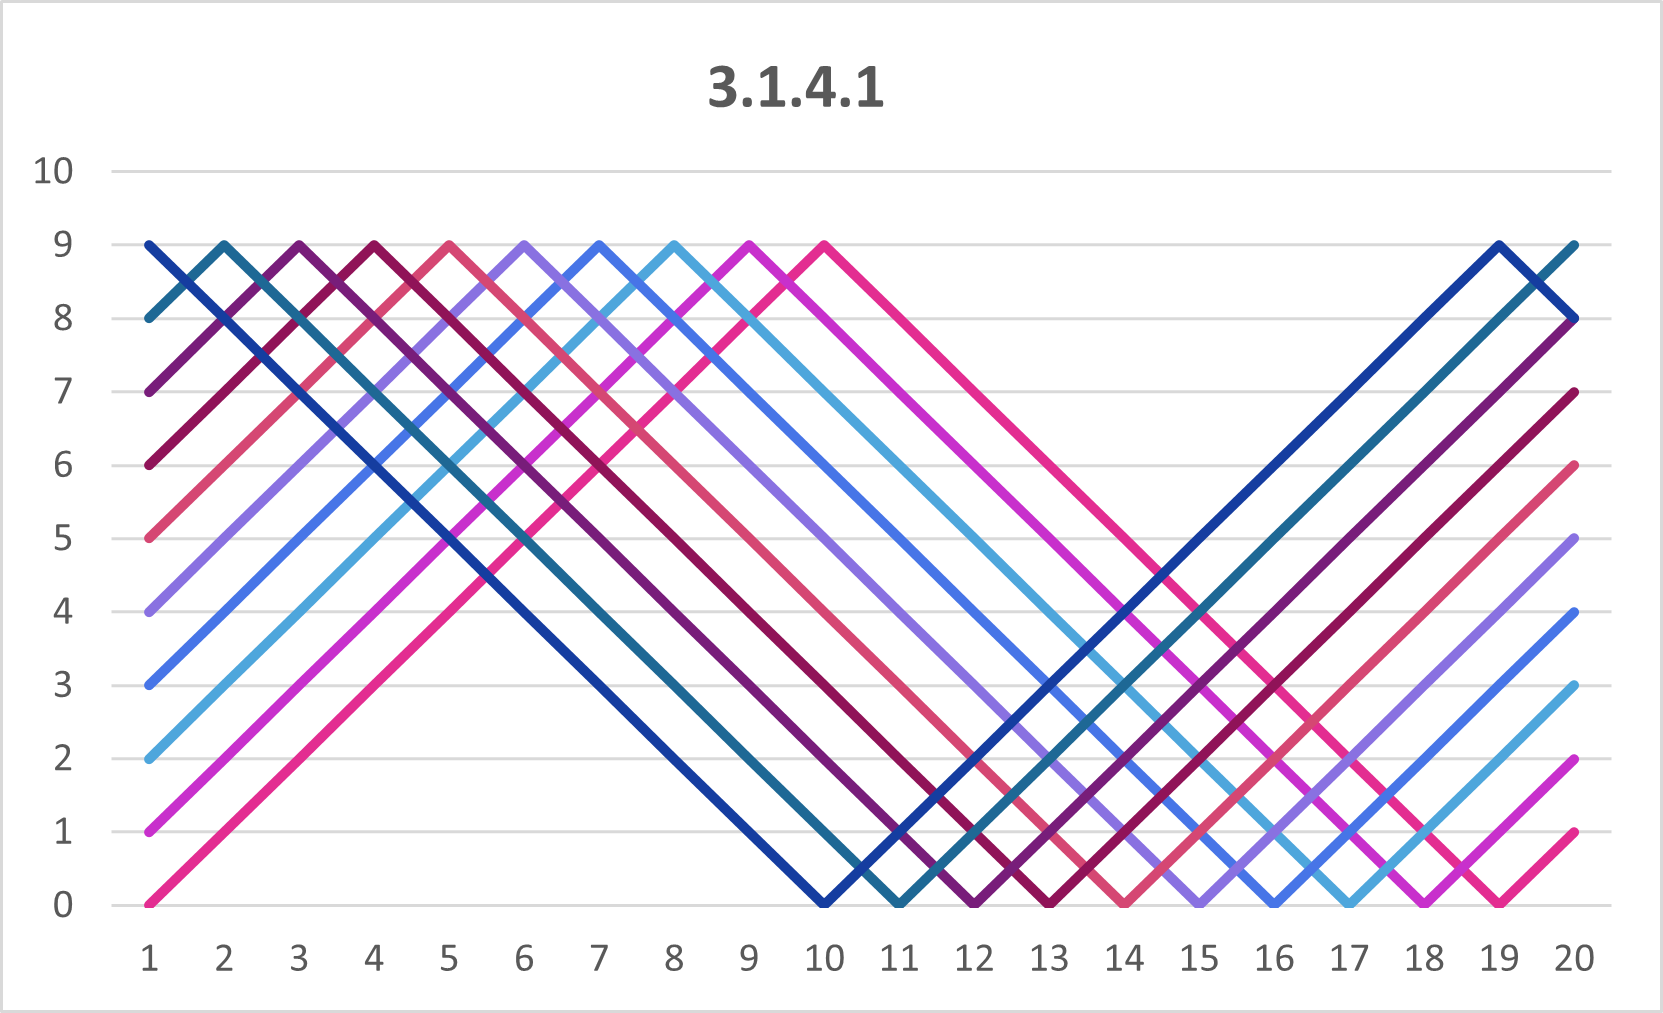
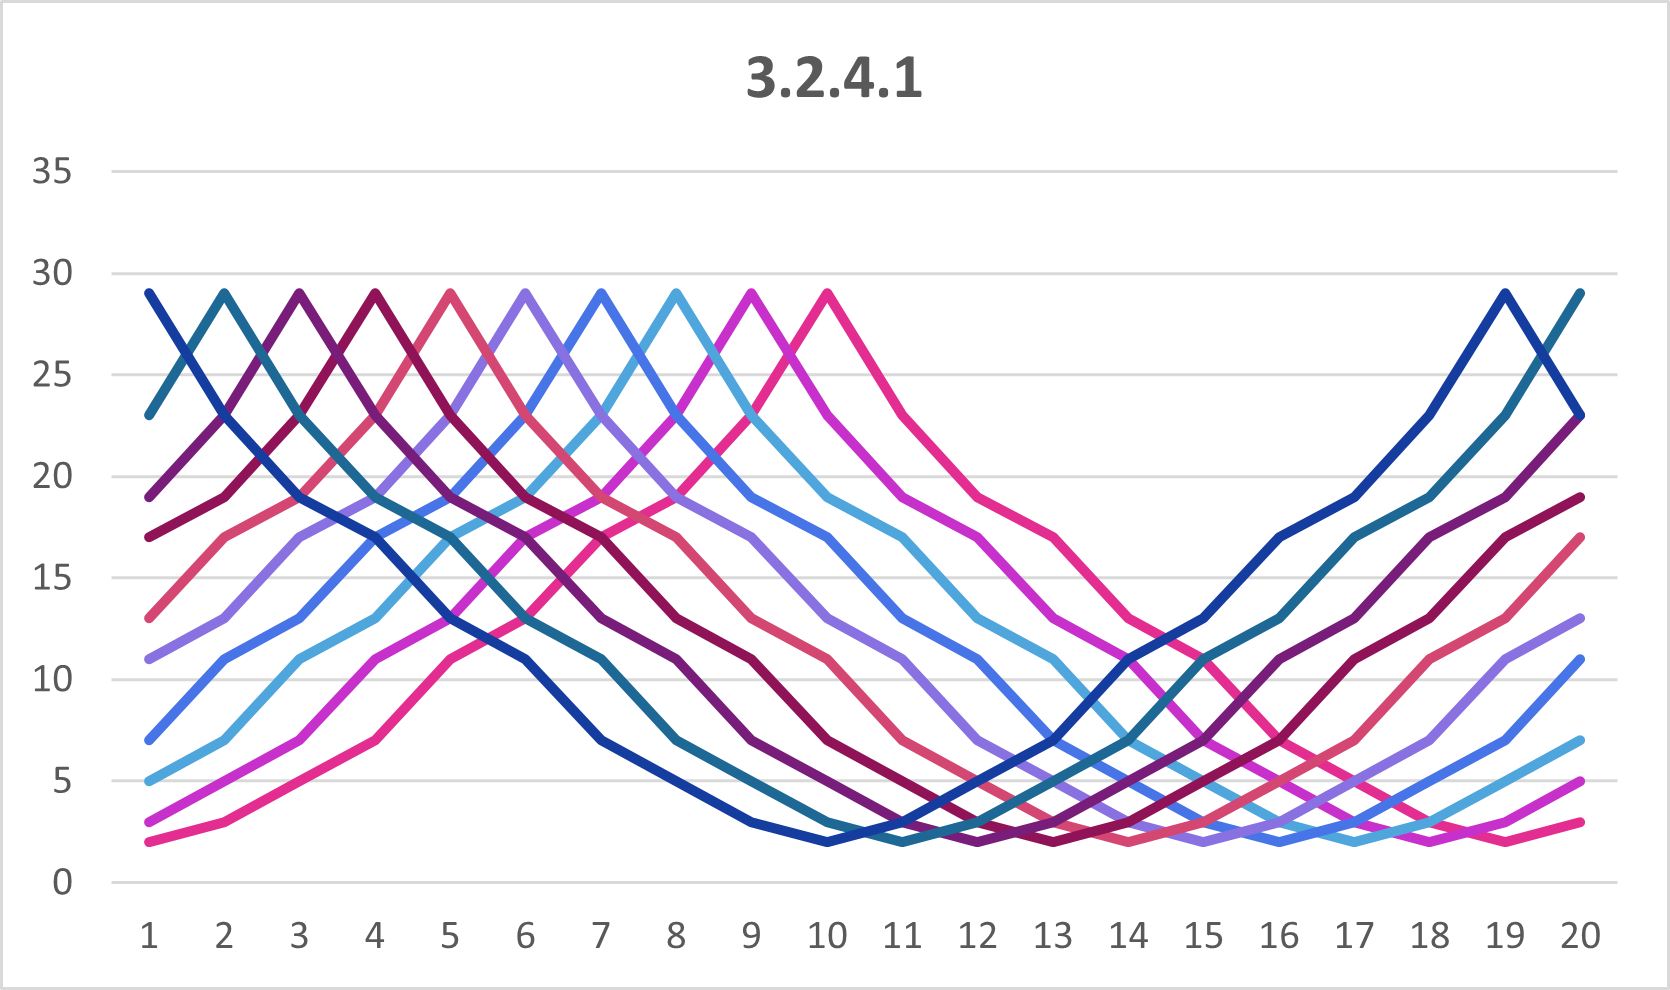
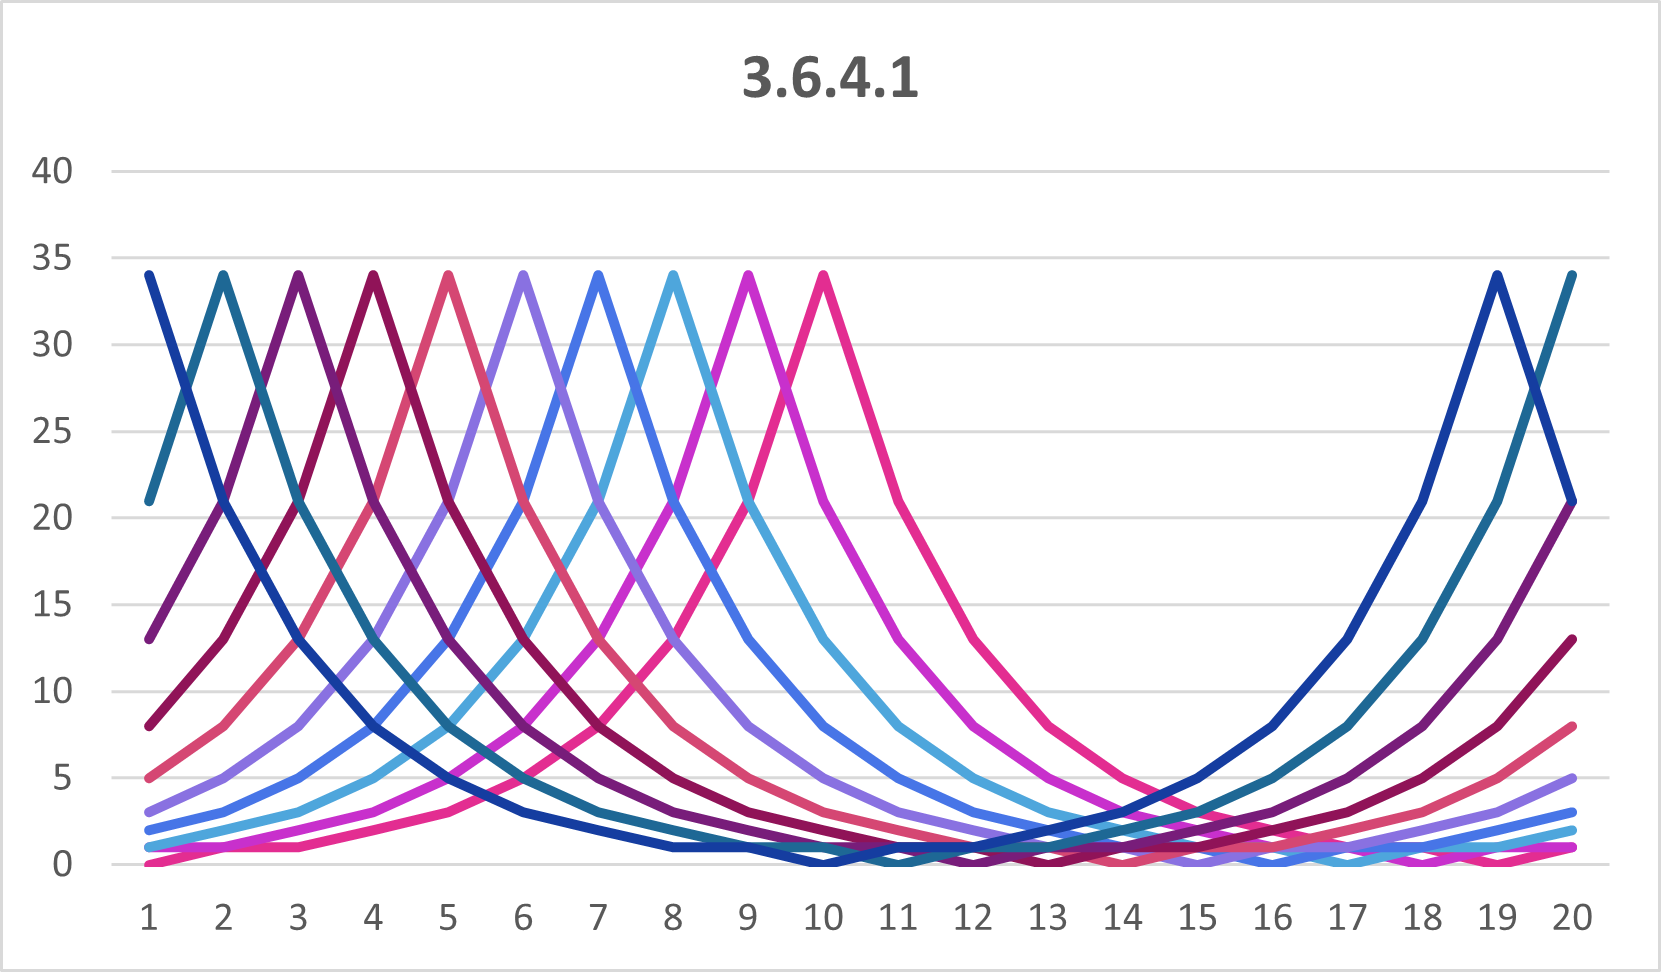
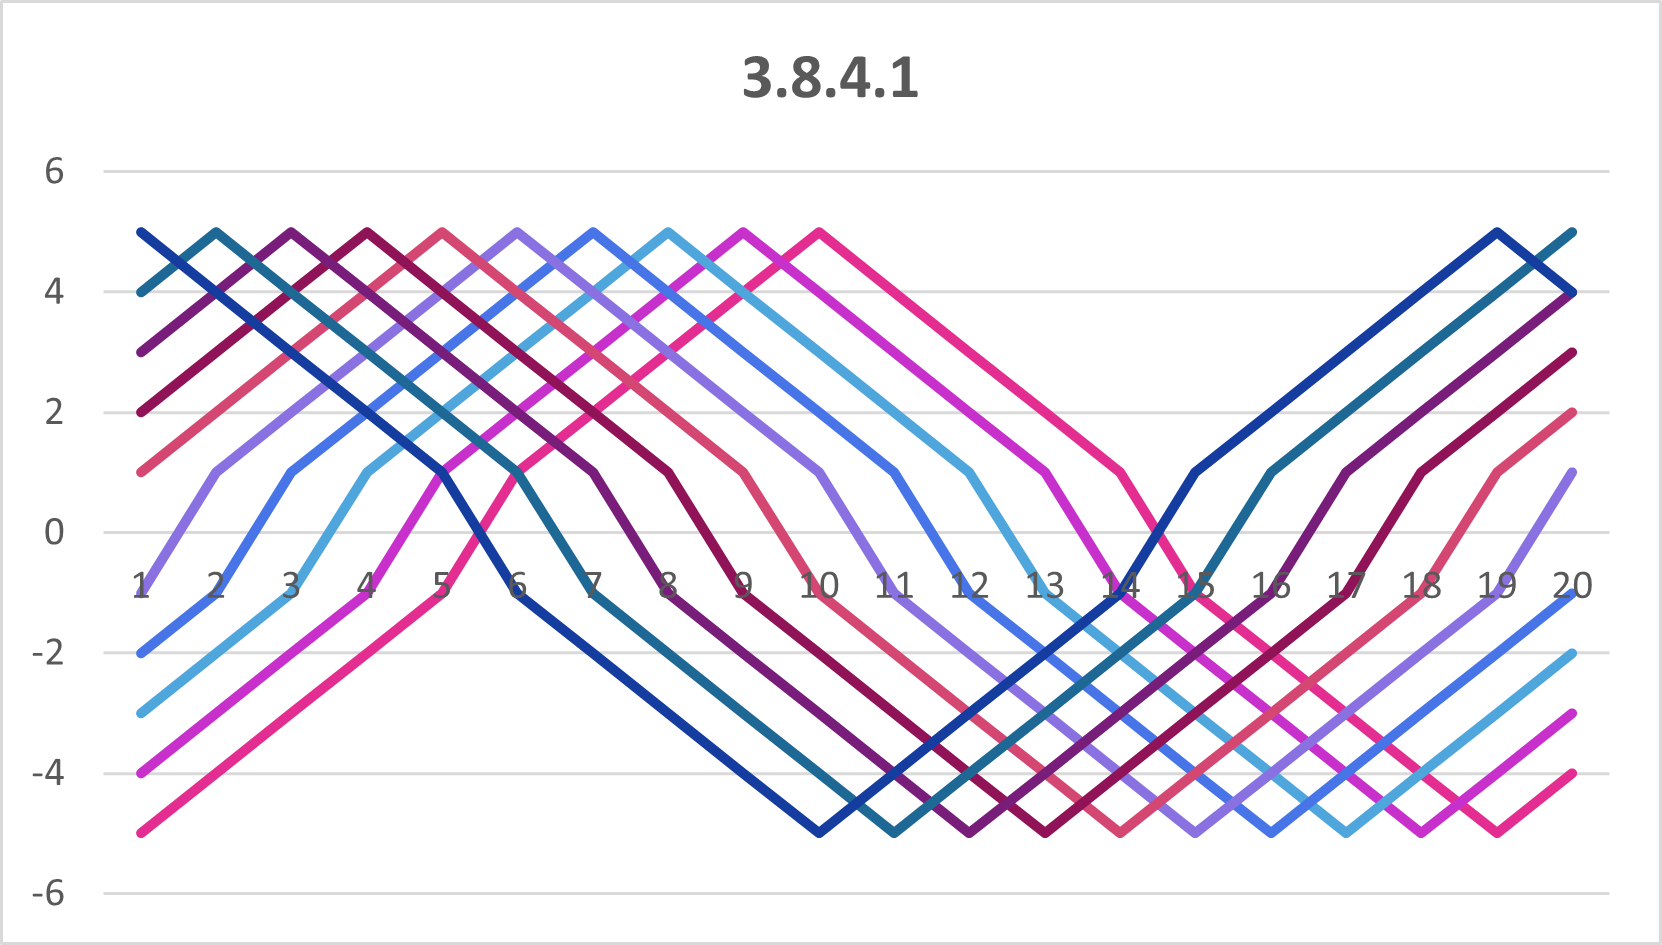
- Various charts are produced throughout the process, with some resulting in unexpected and visually interesting outcomes.
- Interesting visuals are identified based on emergent patterns, contrast, rhythm, and structural variation generated from numbers.
Objective
Through iterative experimentation, this project explores whether Microsoft Excel can function as a generative visual tool by controlling numerical parameters.
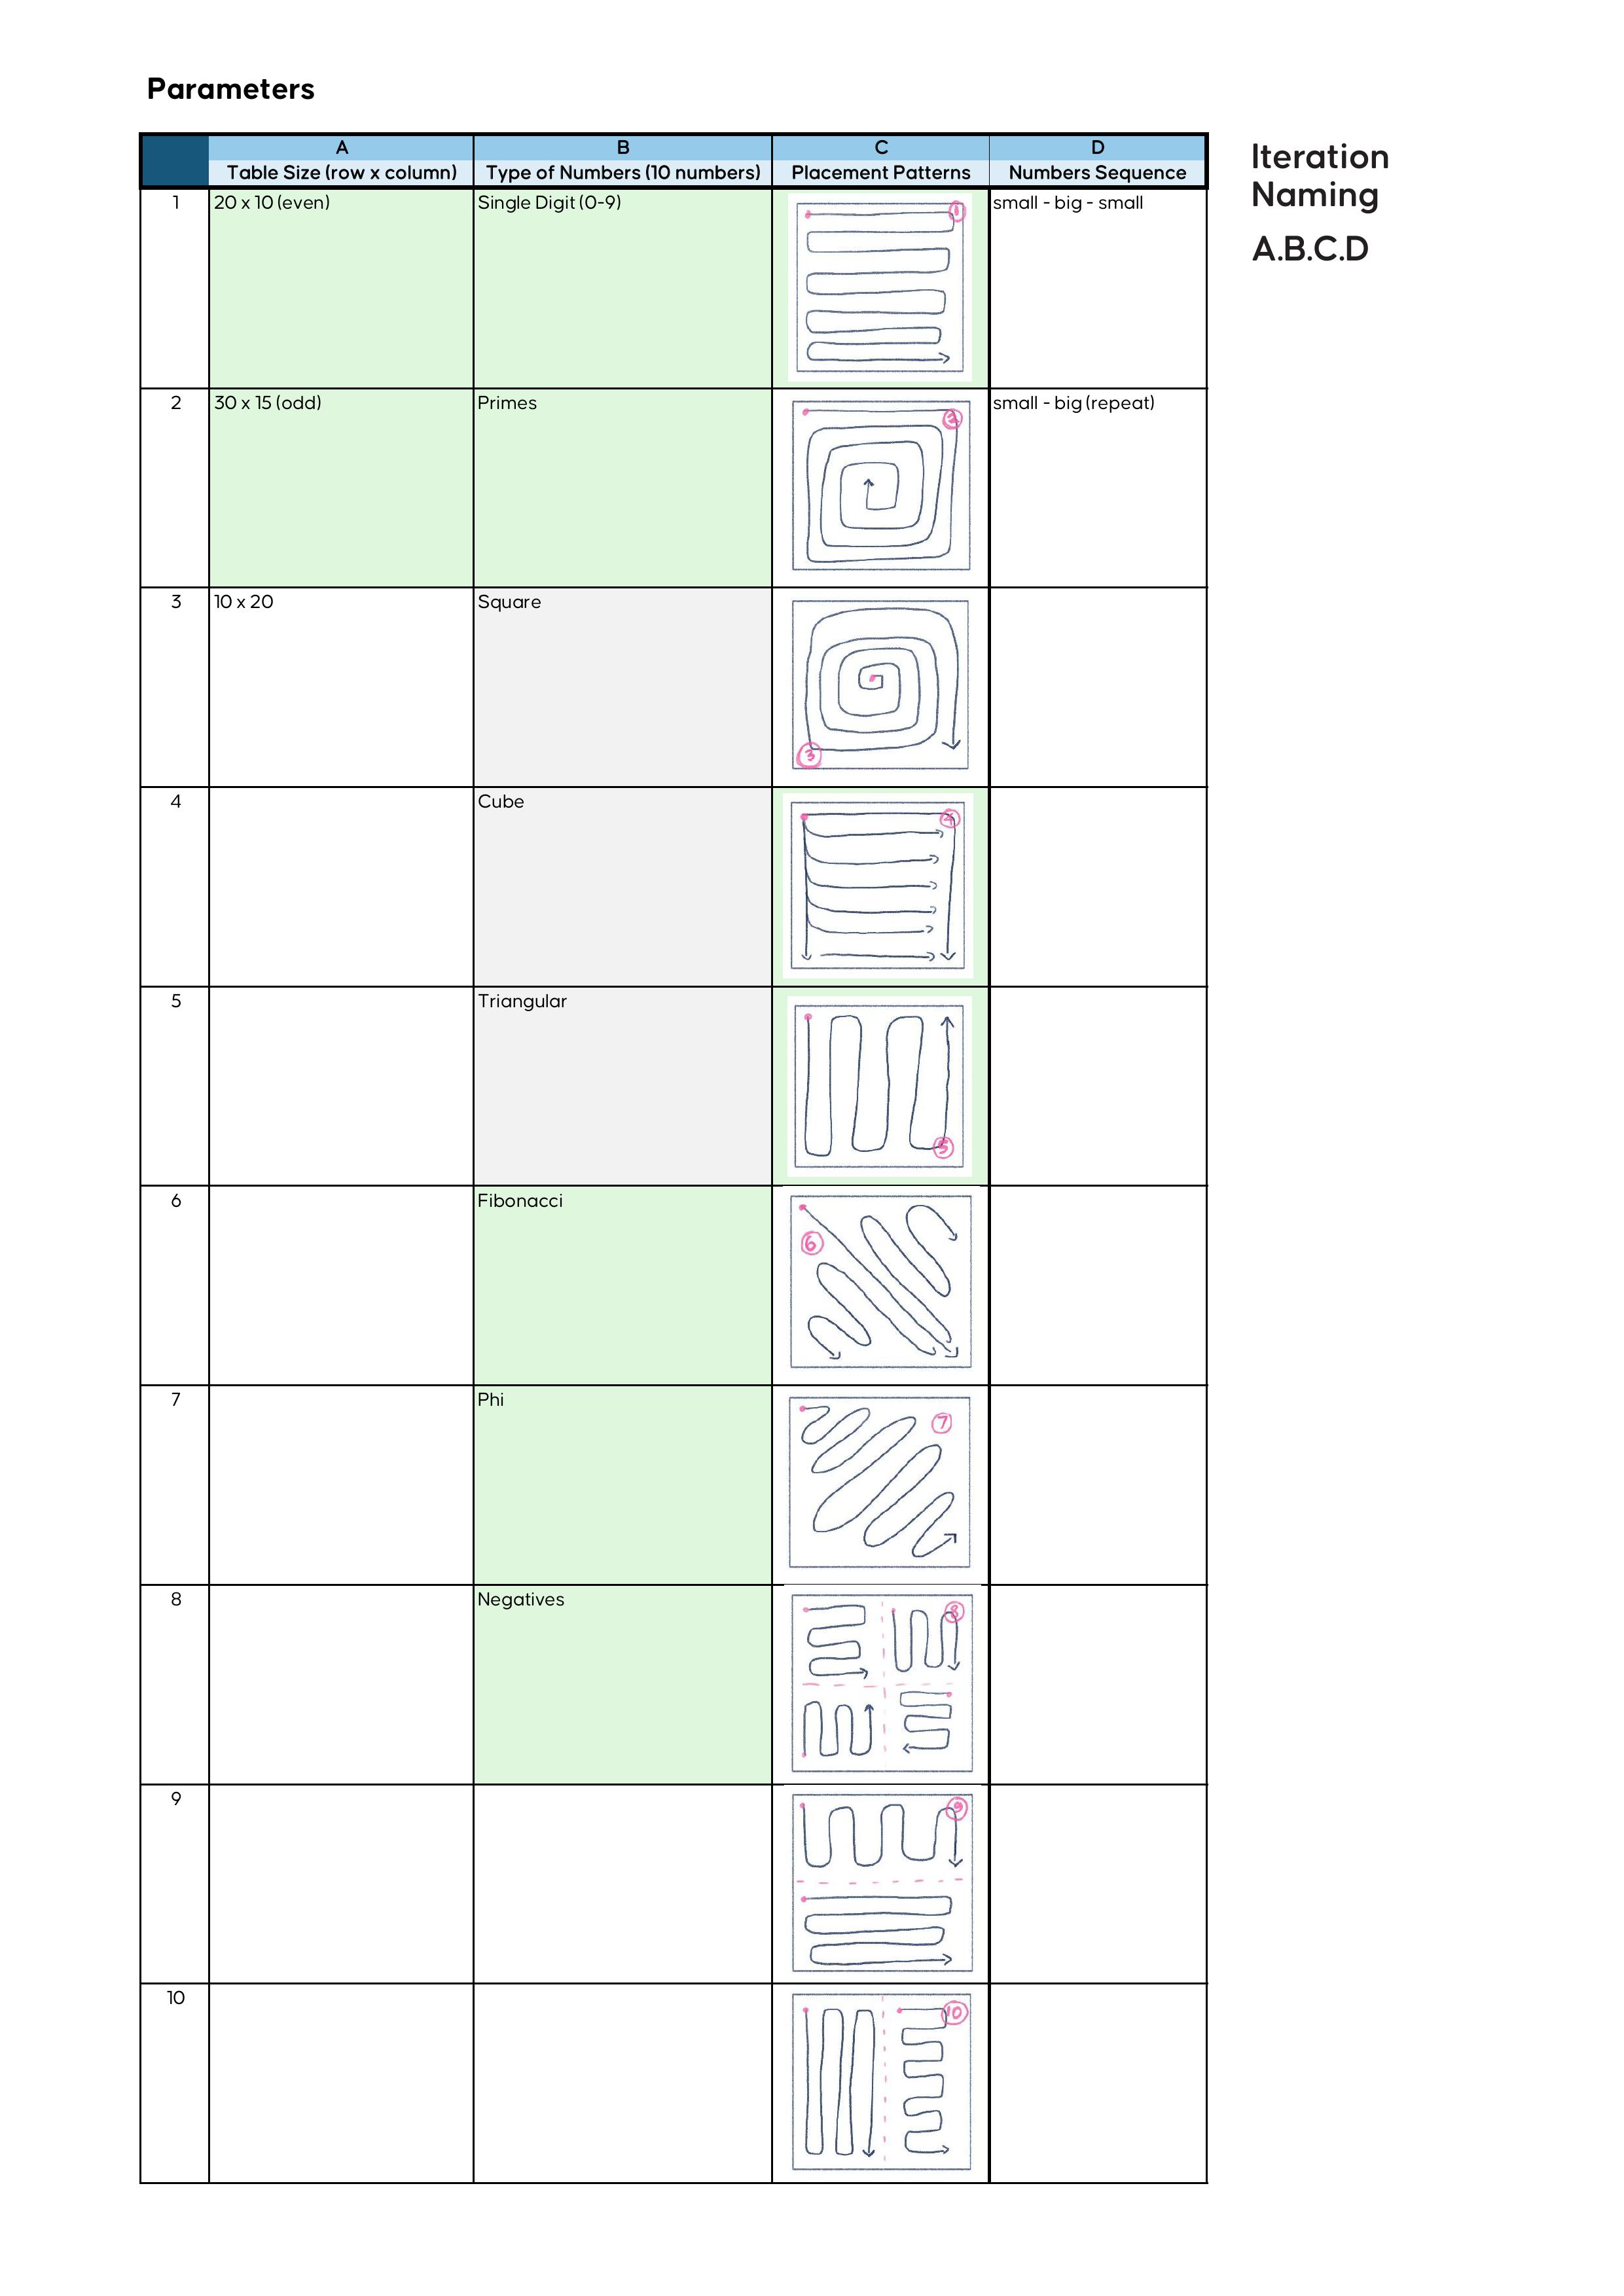
Workflow
- Experiment with combinations of parameters B and C, generating line graphs as the primary evaluation metric.
- Further explore parameters A and D based on promising outcomes from the first stage.
- Generate alternative chart types for iterations that demonstrate strong visual structures.